
The Trade Entry Has Been Triggered – How To Secure Profits?
Entry… triggered! The price rallies to the Moon, but you don’t want to cash out “just yet” - am I right? So, let’s see how to prevent hard landing.
There are obviously several methods to assess risk and thus to manage it, depending on one’s risk appetite or what is also more commonly known as risk profile. One method I use on swing (longer-term) trades is to manually lift my stop once – at least – 50% of the first target has been reached on a swing trade. I provide such trades on Sunshine Profits based on the projections I draw.

Image Source: Unsplash
Let’s take a practical case: in my last trade position on WTI crude oil provided on Nov-30, the market found a floor around $66. Then after being pushed up by the bulls, it rebounded onto that support level ($65.70-66.21), and rallied up to $69.49. So, if we take our reference entry in the middle of the yellow band at $66, the market moved up exactly 70% of the total distance to the target 1.
At this point, to avoid giving profits away, an option would be to lift the stop to net breakeven ($66 + commissions/fees) so that the risk for that trade could get offset once 50% of the distance to the target 1 is passed. Following that, if, for example, the market pursues its rally further – let’s say up to 60% – then the stop will be lifted to net breakeven + 10% of the distance to the target 1.
In our case the market rallied up to 70% of the distance to the target 1, so the stop should be lifted to net breakeven + 20% of the distance to the target 1.
From my experience, this may represent a good way to manually trail your stop. Of course, there are many different methods to do so, but I haven’t heard of many investors or traders mentioning that one, therefore I wanted to present it here.
The following chart is the one I posted in my trade review published on Wednesday, the 1st of December:
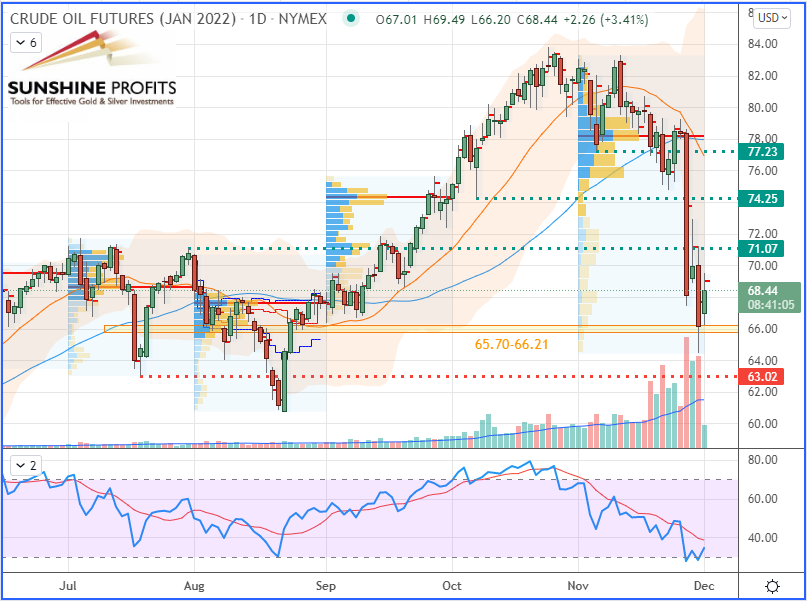
WTI Crude Oil (CLF22) Futures (January contract, daily chart from Dec-1)
To better visualize the price action that occurred, we zoomed into the 4-hour chart:
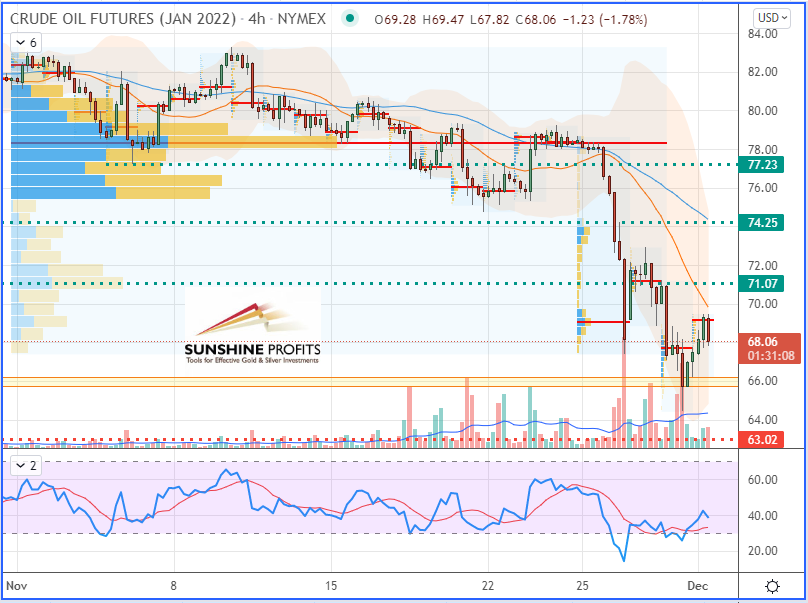
WTI Crude Oil (CLF22) Futures (January contract, 4H chart from Dec-1)
As you can see, the level provided was optimum given its function to act as a floor for rebounding prices. Then, the market was up to 70% of the total distance to reach the target 1, and finally reverted back down to the stop level.
Now, this is today’s chart:
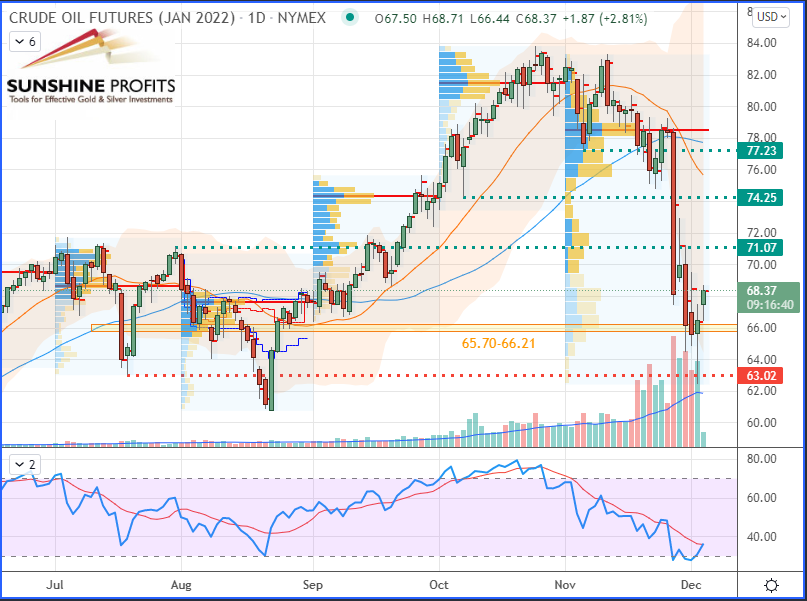
WTI Crude Oil (CLF22) Futures (January contract, daily chart)
Again, a zoom into the 4H chart lets us see more details of the price action that occurred:
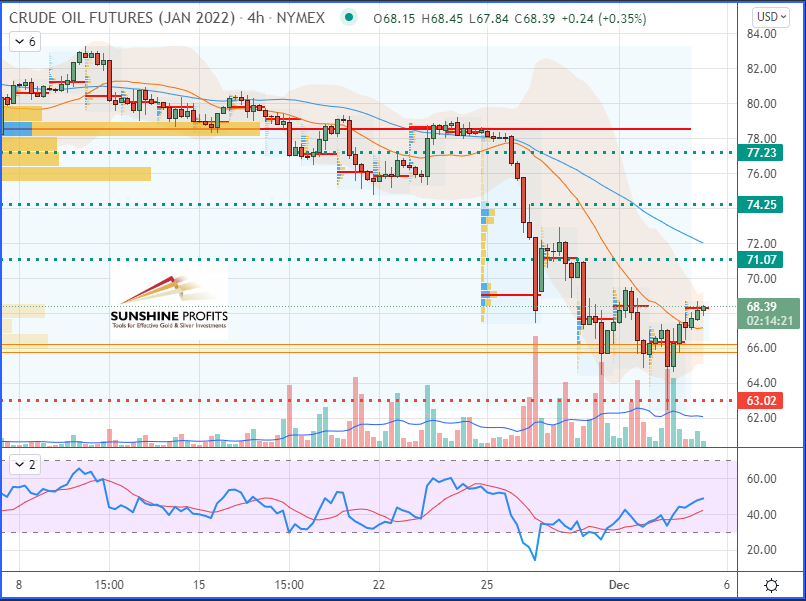
WTI Crude Oil (CLF22) Futures (January contract, 4H chart)
Disclaimer: All essays, research and information found in this article represent the analyses and opinions of Sunshine Profits' associates only. As such, it may prove wrong and be ...
more

