
Natural Gas Elliott Wave Technical Forecast
Natural Gas Elliott Wave Analysis – Trading Lounge Daily & H4 Chart
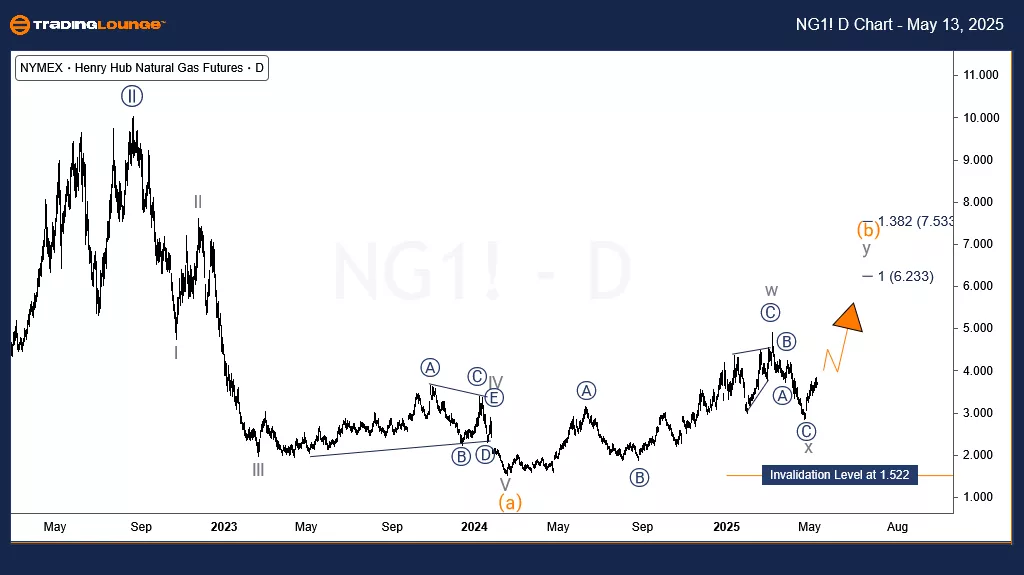
Natural Gas Could Extend Its Recovery Toward $6.2
Natural Gas appears to be continuing its bullish recovery from the late April lows. This movement could be part of a broader cycle that started in February 2024, with a potential upside target around $6.2.
Natural Gas Daily Chart Analysis
The daily chart shows that Natural Gas concluded a bearish impulse wave—wave (a) of the super cycle—from the peak in August 2022. This downward structure completed in February 2024. Since then, a bullish corrective phase has begun, consistent with the Elliott Wave theory’s rule that a 3-wave correction typically follows a 5-wave impulse.
Wave (b) may be unfolding as a double zigzag correction. The first leg, wave W, formed a zigzag and ended in March 2025. This was followed by wave X, another zigzag, which concluded in late April 2025. The current upward momentum likely represents the beginning of wave Y. If this pattern continues, prices could reach $4.9 and potentially rise toward $6.2, with the 1.522 level as the critical invalidation threshold.
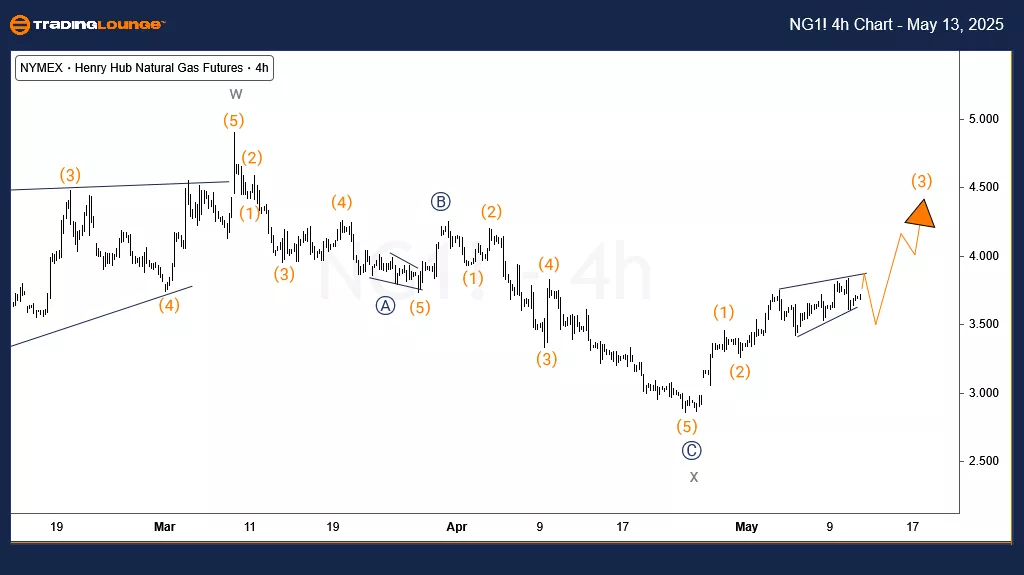
Natural Gas H4 Chart Analysis
On the H4 chart, price action indicates the development of wave (3) within ((1))/((A)) of X. This structure suggests more upside is likely, with the 2.85 level serving as a key support. In the short term, traders are advised to wait for a completed five-wave sequence from the late April rally. A pullback following that sequence could present a strong buying opportunity.
Technical Perspective Source:
More By This Author:
Unlocking ASX Trading Success: Cochlear Limited - Tuesday, May 13
Elliott Wave Technical Analysis: Exxon Mobil Inc. - Tuesday, May 13
Elliott Wave Technical Analysis: New Zealand Dollar/U.S. Dollar - Tuesday, May 13
At TradingLounge™, we provide actionable Elliott Wave analysis across over 200 markets. Access live chat rooms, advanced AI & algorithmic charting tools, and curated trade ...
more

