

Image Source: Pixabay
Gold Pulls Back, But the Disconnect in GLD Tells a Bigger Story
Gold settled yesterday at $4,176.69, down 0.44% on the day. Not a huge move. But that’s not what got traders' attention.
The U.S. Gold Fund (GLD) - the most widely traded gold ETF - fell by a much steeper 2.1%, a gap of more than 1.6 percentage points to the physical metal.
That kind of divergence is rare and meaningful.
Let’s break it down technically
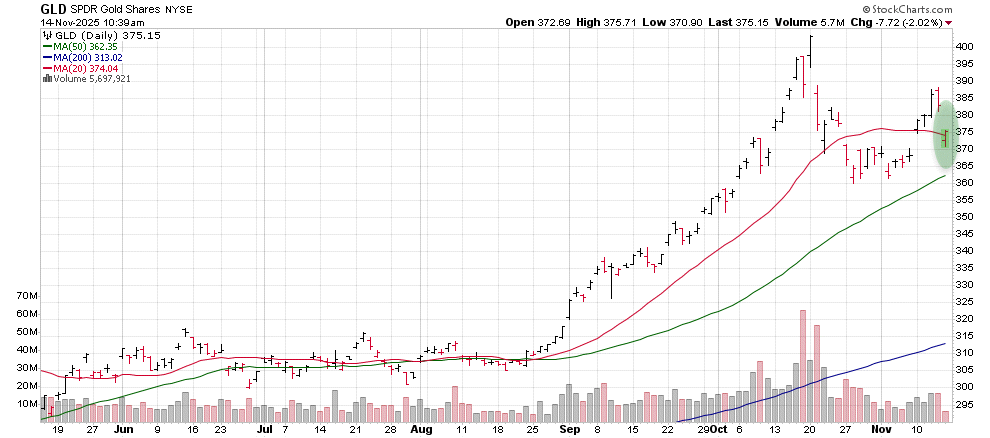
GLD is a proxy for physical gold.
It tracks the metal’s price, but it’s not the metal itself - it’s a share that reflects exposure to gold, with its own market dynamics.
On days with heavy volume, the price of GLD prices can disconnect from spot gold prices as institutional and retail flows create temporary supply/demand imbalances.
That’s what happened yesterday. But in reverse.
Instead of crowding in - like during a Fear of Missing Out rally - investors flooded out of GLD, pushing the ETF sharply lower while the metal itself held relatively steady. This created a short-term discount in GLD relative to actual gold, driven by liquidation rather than fundamentals.
Does This Matter?
Yes - not because it offers a surefire arbitrage opportunity (that window is typically reserved for large institutions), but because it reveals a deep look inside of current investor psychology and sentiment.
This kind of dislocation often signals forced selling, panic, or broad liquidation - not a breakdown in the asset itself.
In fact, this specific pattern of GLD selling harder than gold suggests that investors are raising cash, not repositioning away from gold.
That knowledge alone is worth its weight… Don’t make me say it.
We know from Warren Buffett - and other market sages - that the best time to buy is when there is blood in the streets.It’s uncommon to see a “bloody” situation in the gold trade, but yesterday’s disparity between spot gold prices and the U.S. Gold Fund prices is a close second.
That disparity means that the selling pressure on Gold is likely close to an end and we’ll be talking about new all-time highs in gold soon after the buyers step in to fill the vacuum.
(Click on image to enlarge)
What’s Still Supporting Gold?
Despite yesterday’s selloff, the bullish case for gold in 2025 remains fully intact:
- Persistent uncertainty out of Washington and the global geopolitical stage
- Stubborn inflation pressures
- Slowing jobs and economic outlook
- Weakness in the U.S. Dollar
- Ongoing accumulation by global central banks
All these macro drivers remain in play.
Technically, both the daily and monthly charts for gold remain in a confirmed uptrend. The metal is still above key moving averages and long-term support zones, and the October correction - extended by this week’s fear-driven flush - continues to look like a healthy retracement within a broader bullish structure.
Bottom Line
The gap between gold and GLD isn’t a broken signal — it’s a fear signal. The kind that tells you smart money is taking advantage of short-term liquidity events while the crowd runs for cover.
If you believe in the long-term thesis - and the chart still does - this is a dip worth watching.
More By This Author:
Down 27% In The Past Month, Is Oracle Stock A Buy?
With Rigetti Down 23% This Week, Is Now A Good Time To Buy RGTI Stock?
Cisco Just Beat Fiscal Q1 Earnings But What Lies Next For CSCO Stock?


Comments
Log in or sign up to join the conversation.