

Image Source: Unsplash
Cisco (CSCO) represented one of the few positive highlights in an otherwise dreary day in the market. On Wednesday after the closing bell, the digital communications technology conglomerate reported strong financial results, along with an upbeat outlook. Subsequently, CSCO stock popped more than 7% in yesterday’s extended session. Still, with the enthusiasm now integrated into the security’s sentiment profile, prospective investors may need to tread carefully.
For the fiscal first quarter, Cisco posted adjusted earnings per share of $1, beating out Wall Street analysts’ consensus target of 98 cents. On the top line, the company generated $14.88 billion, exceeding expectations calling for $14.77 billion. Notably, revenue increased 8% against the year-ago period. It’s also the fourth straight quarter of growth following a stretch of top-line erosion.
For the fiscal second quarter, Cisco anticipates revenue to land between $15 billion and $15.2 billion, pipping the $14.6 billion forecast made by analysts. Further, adjusted EPS may reach between $1.01 and $1.03, again beating out estimates, in this case calling for 99 cents.
Moving forward, though, investors won’t be able to rely on the strong print as it has already been baked in. That’s where quantitative analysis, which treats price behaviors as a discretized, measurable probability space with real outcomes and distributions, can provide meaningful insights.
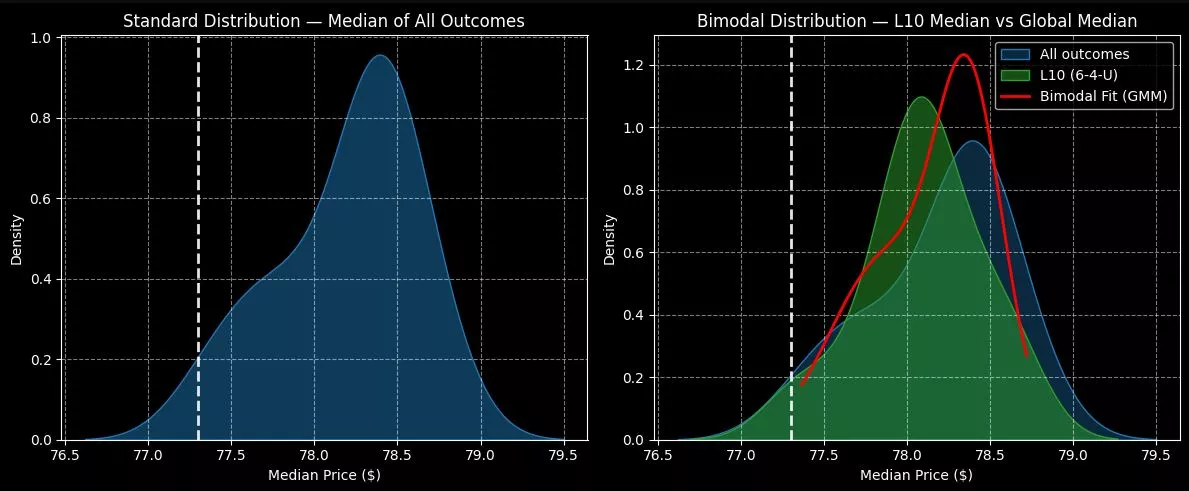
Using Kolmogorov-Markov frameworks layered with kernel density estimates, the forward 10-week median returns of CSCO stock can be arranged as a distributional curve, with prices landing between $76.60 and $79.50 (assuming an anchor of $77.30). Further, price clustering would likely be predominant at $78.40.
The above assessment aggregates all sequences going back to January 2019. However, the current condition is slightly different from the homeostatic state, with CSCO stock structured in a 6-4-U formation; that is, in the trailing 10 weeks, CSCO printed six up weeks, four down weeks, with an overall upward slope.
Under this condition, the expected 10-week median returns would shift to the left (toward zero). Moreover, price clustering would likely occur at $78.10. While there’s not much of a difference between the two distributions, investors should at least realize that the chance of upside is slightly less relative to baseline conditions.
More By This Author:
Nvidia Is Getting Ready For Q3 Earnings: Here’s What’s On TapAMD Ready To Rocket Higher On Ambitious AI Ambitions
Rocket Lab Swings Higher On Record Q3 Revenue But What Lies Next?


Comments
Log in or sign up to join the conversation.