
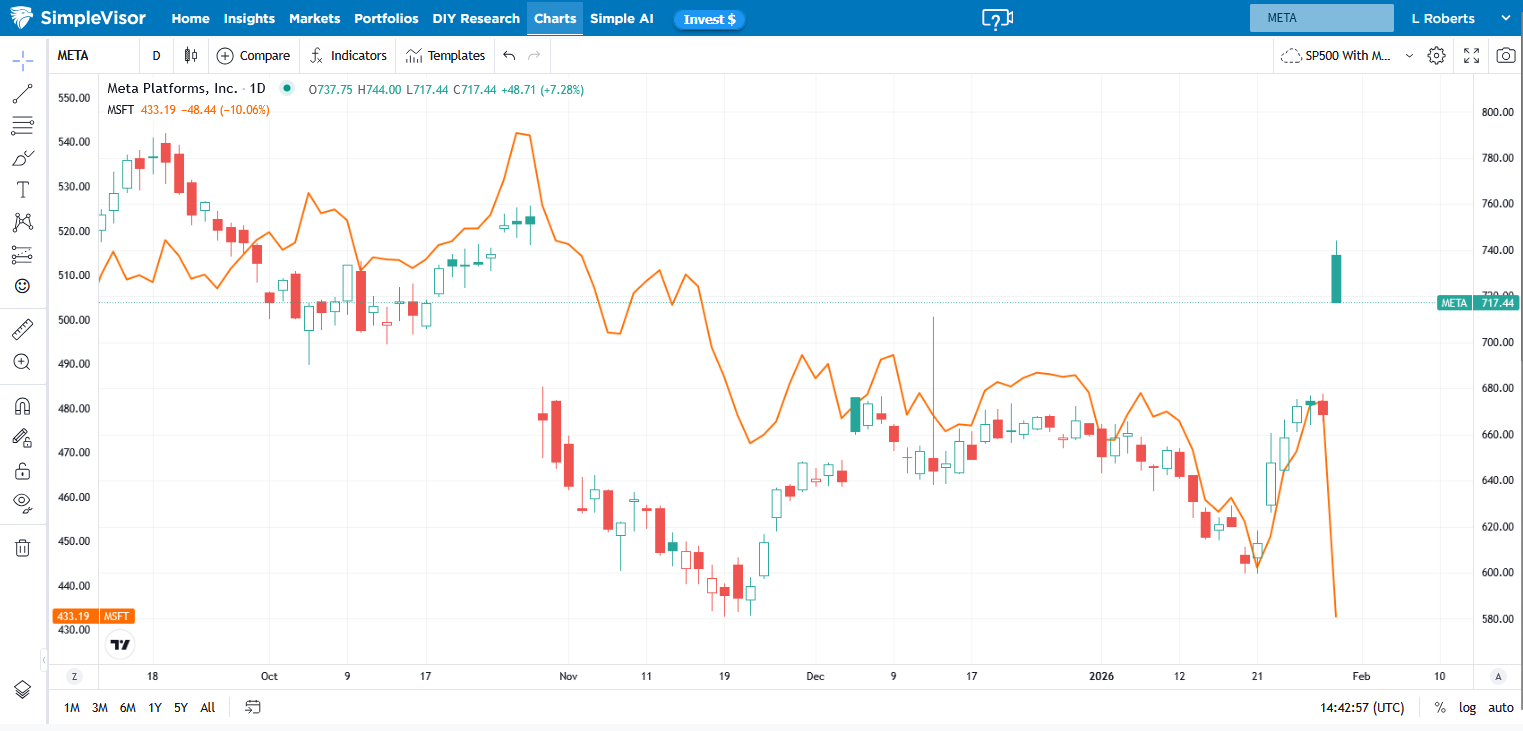
Meta And Microsoft: Great Earnings But Different Results
On the heels of strong fourth-quarter earnings reports, Microsoft is opening down 8%, while Meta is trading up 10%. Microsoft topped expectations for earnings and revenues. However, there is some concern about its total cloud revenue. They reported cloud revenue of 26% versus expectations of 28-29%. That said, their leading cloud computing product, Azure, grew by 39%, a testament to the strong AI-driven growth. We are also hearing that investors are growing concerned that Microsoft’s elevated capital expenditures (CapEx) on data centers and AI infrastructure could weigh on profit margins.
Interestingly, three months ago, after reporting third-quarter earnings, Meta’s stock fell sharply despite beating on earnings and revenues. Like Microsoft today, there were concerns about their higher-than-expected CapEx forecast. In Wednesday’s fourth-quarter report, they stated that operating costs climbed sharply as AI infrastructure investments accelerated. The company also dramatically increased its 2026 CapEx forecast ($115–$135 billion) and raised its total expense guidance. Unlike Microsoft, investors seem to love the news.
Meta and Microsoft both crushed it on the earnings front, but had completely different stock price results in part due to CapEx spending. This confusing take on CapEx spending will likely be a theme through this quarter’s remaining earnings reports and for the foreseeable future.
(Click on image to enlarge)
What To Watch Today
Earnings
(Click on image to enlarge)

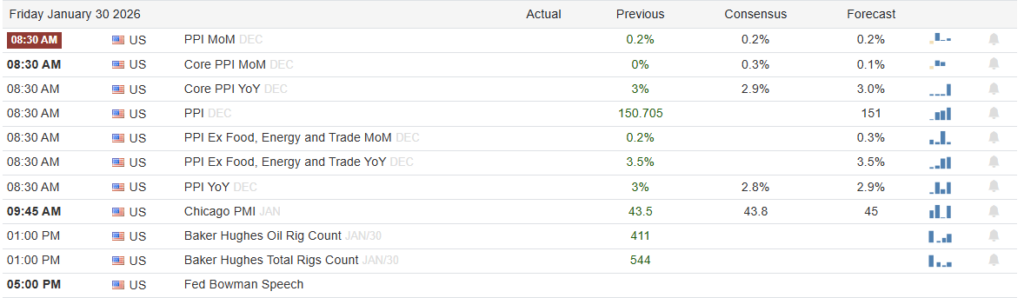
Economy
(Click on image to enlarge)
Market Trading Update
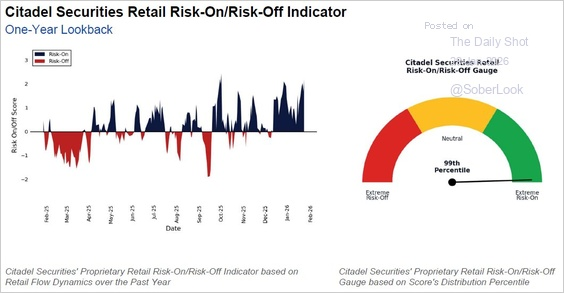
Yesterday, we discussed a bit of the technical backdrop of the market going into last night’s earnings. While earnings from Microsoft and Meta were very good, with both reporting strong revenue and earnings growth, the very lopsided positioning going into last night’s reports set the market up for disappointment. Yesterday morning, the markets sold off immediately after the open, with technology names under the most pressure; however, bitcoin, metals, emerging markets, and international markets also took a hit. However, such isn’t surprising given that investors were very long equities going into earnings season. As shown, Citadel Securities, which pays for Robinhood’s order flow, published its retail investor risk-on/off sentiment indicator. At 99%. It is the most risk-on reading since last October, coming off the April “Liberation Day” lows.
(Click on image to enlarge)
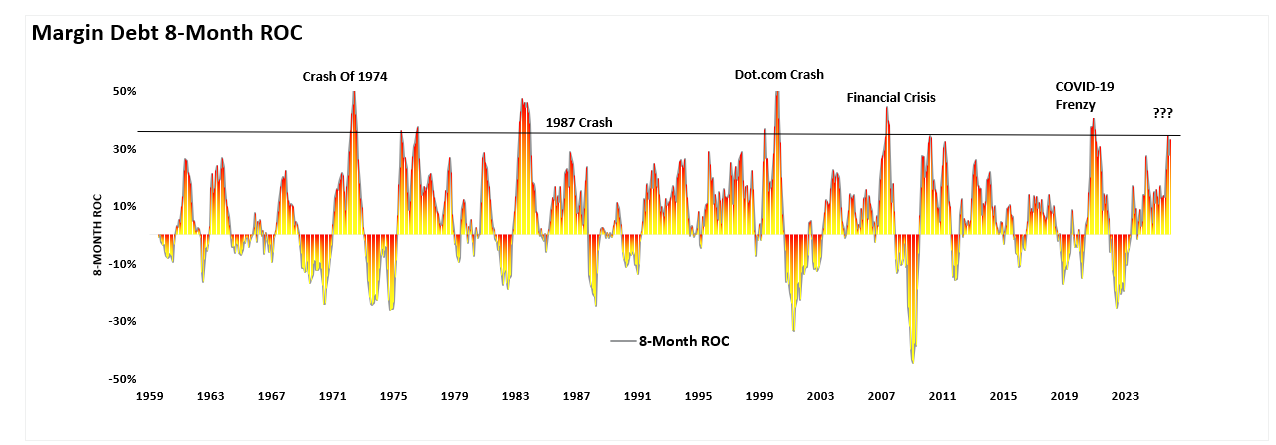
Furthermore, the 8-month rate of change in margin debt is now at one of the highest readings in previous history. Such current readings have occurred only about 5 times previously, and all preceded more significant market corrections. Note: This is a monthly indicator that lags, so these readings can remain very high for quite some time. Notably, rising margin debt is bullish for the market in the near term, as it adds buying power.
(Click on image to enlarge)
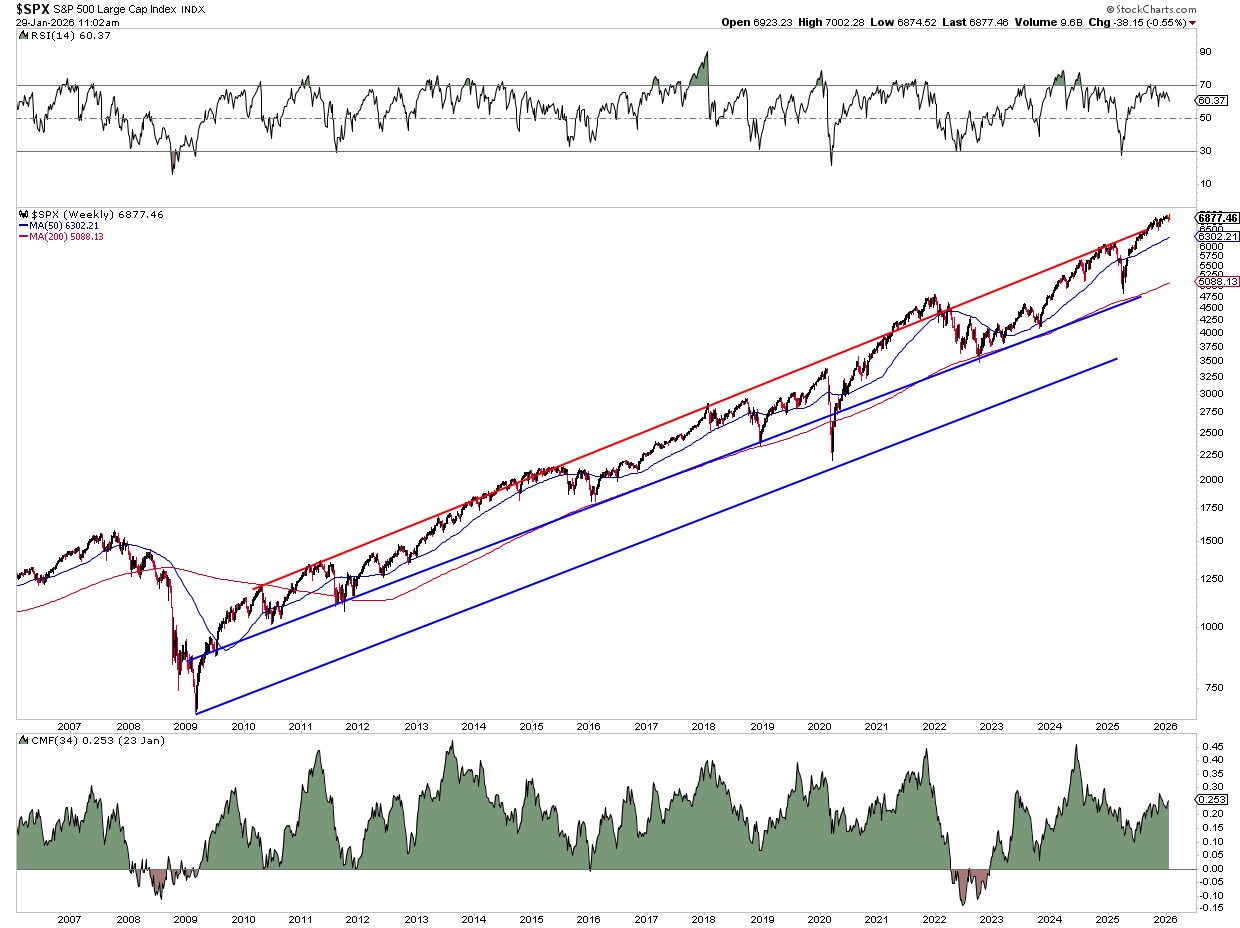
While yesterday’s sell-off was fairly brutal, the market backdrop remains intact. The weekly chart below shows that while the market is wrestling with the 7000 resistance level, that level also coincides with the long-term bullish trend where markets have struggled previously. Also, money flows remain strong, at least for now, suggesting that any pullback to near- or intermediate-term support will likely be bought. The negative divergence in relative strength is a concern; however, the markets, particularly when very speculative, can ignore technical warnings for some time.
(Click on image to enlarge)
While a more severe correction remains a low probability event, the current correction should not be a surprise either, as leverage and speculation have gone “too far, too fast.” For now, while it may “feel like we must do something,” it’s most likely the best option to “do nothing.” Let this volatility settle out for a couple of days, then review allocations and investments and adjust accordingly if needed.
The Silver Myth
The Tweet below is one of many social media claims that the price of silver trading in the US on the COMEX exchange is well below asian prices. To wit, the tweet below shows a 15% premium for physical silver in China relative to the US futures market. The problem with the tweet and the myth that demand is much stronger in China, leading to a premium, is that it doesn’t account for China’s value-added tax (VAT). For more details, we share a piece from Andreas Steno Larsen:
In short, Silver is treated as an industrial metal (in contrast to Gold and Platinum) by the Chinese tax authorities, which means that Silver is a “duty paid” instrument on exchange (the standard is to price in the VAT of 13% and then allow the physical buyer to either claim it or not depending on their VAT status). This is governed by the article 36, 53 in the SHFE delivery rules.
So the bottom line is that the more speculators and small participants we see in the market, the more likely it is that we trade at 13% premias or above in Shanghai versus the West. The current premium is VAT-based, and a STRONG sign that small speculators are ALL IN on the trade.

Tweet of the Day

More By This Author:
Mainstream Expectations: Hope Vs. Potential RiskThe Energy Sector Is Outpacing Energy Prices
European Buyers Strike Or Performance Chasing?
Disclaimer: Click here to read the full disclaimer.


