
Merry Metals

Image Source: Unsplash
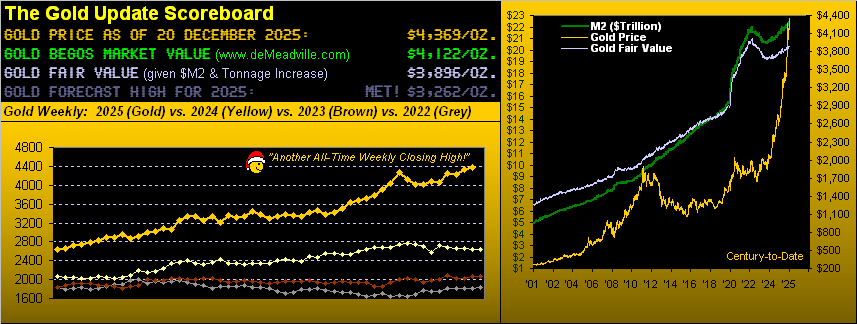
Merry metals, indeed. En route to finishing the final full trading week of 2025, both gold and silver made fresh all-time highs.
(Click on image to enlarge)
Here are their respective movements toward the end of the trading week:
- On Thursday, gold traded to as high as 4410 before closing Friday at 4369, +66% year-to-date;
- On Friday, silver traded to as high as 67.68 before closing at 67.40, +130% year-to-date.
You may ask, "what about the numbers from 2001?" Well, we should save that for our year-end publication. However, just like Hollywood, I will tease it. So, century-to-date:
- Gold is presently +1,496%;
- Silver is +1,352%;
- and the S&P 500 (ex-dividend) is +418%.
Funny how financial media focuses on the latter (i.e., the least-gainer) of those three; but precious metals investing is too boring for the followers of financial media to generate enough lifeblood (advertising revenue).
In the year's final two "holiday-shortened" weeks, there are just seven and a half trading days left within the holiday haze, risking one becoming lost in the merry markets’ maze.
Bearing in mind that “trend trumps hype”, our best grasp on the market's rhythm on a pure swing basis for gold is currently the 12-hour parabolics, while for silver it's the six-hour moneyflow. Here — with the benefit of hindsight — are the cumulative results of the last 10 pure swings for both metals.
Keep in mind that this based on futures contracts, in which a one-point move in gold is +/- $100 and the same for silver is +/- $5,000.

Still, from the mean reversion at 4369, gold is 12% above the fair value of 3896, vis-à-vis the regression of gold’s price to the U.S. “M2” Money Supply, duly incorporating the increase in the yellow metal (which is now at around 218,000 tonnes, having doubled since April 1986).
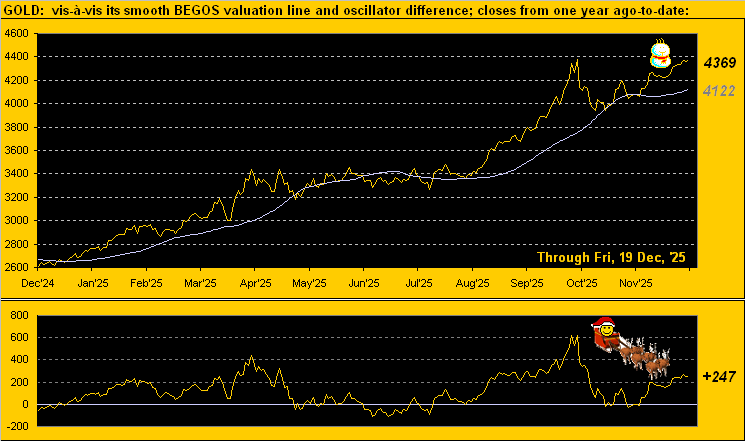
Depicted below is the pricing of gold by its movement relative to those of the five primary BEGOS markets (bonds, euro, gold, oil and the S&P 500). At 4369, it is +247 points (+6%) “high” above its smooth valuation line at 4122.
(Click on image to enlarge)
As for silver (which is not a part of the BEGOS component for a market value calculation), the gray metal, at 67.40, is +20% above the fair value of 56.13. So as merry as our metals are, remember that corrections will occur; try not to get carried away.
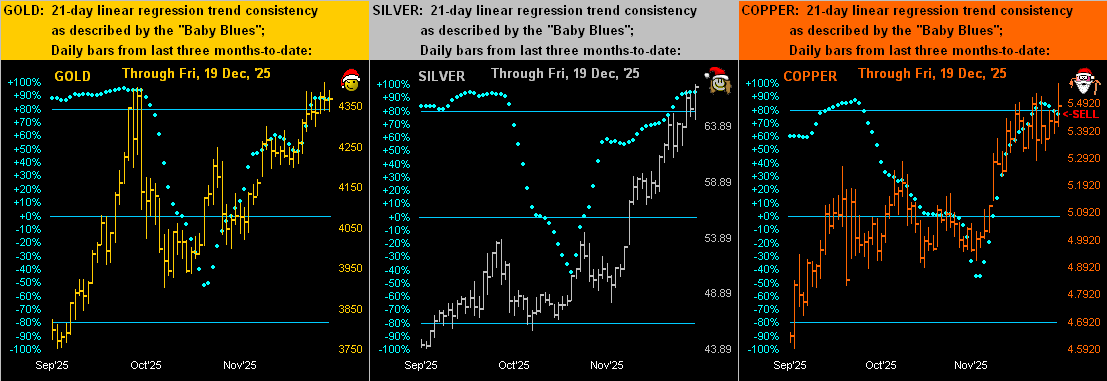
We will now turn to the metals' market trends for the last three months, featuring gold on the left, silver at the center, and copper on the right. As you likely know, copper often influences silver. Copper's blue dots on the graphic indicate regression trend consistency. Note the sell signal it provided, as it slipped below the key +80% axis.
So, how have these sell signals affected silver previously? Over the year, there have been four sell signals in copper, which then saw silver dropping withing a one-month period, by as much as -21.3%, -5.5%, -0.4%, and -14.8%, respectively. This is just a little something to be aware of.
(Click on image to enlarge)
Of course, the significant chart in this text is the price’s weekly bars and parabolic trends from one year ago-to-date. And as we reiterate with a rhyme, the picture looks great. The fresh parabolic long trend is now two weeks in duration with a net price gain of +3.3%. As for old lurking Ebenezer, we told him away back in 1843, when priced at $20.67/oz., that “shorting gold is a bad idea” (it having since risen 21,037%).

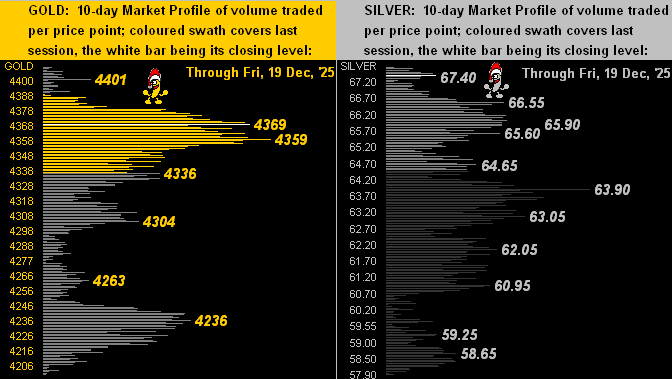
Depicted below are the market profiles for gold (on the left) and for silver (on the right). With such an array of underlying support levels, it truly is a merry celebration, which is really saying something.
We will now turn our focus toward the economic data (or lack thereof) we have on top. Per the next graphic, there are still about 40 “shutdown” metrics which haven’t arrived (some of which won't ever arrive).
And while November’s inflation at the retail level was again recorded at a +0.2% monthly clip, the Philly Fed Index took a hit in recording its fifth negative month through the last seven. Moreover, the economic barometer has been beleaguered throughout December per those metrics made available:

Yet despite these woes, the S&P 500 still seeks a Santa Claus rally, with the index now down just -14 points from November’s close. We’ve recently pointed out that for the 24 completed Decembers thus far this century, 16 have been up, (which, for those not paying attention, means eight have been down).
Regardless, those in financial media have been panicking. This past week brought two items of note from the writing pool at the once highly-respected Barron’s. To wit:
- “Stock Markets Are Suffering Amid Bubble Fears.” Suffering? The S&P settled on Tuesday a scant -1.5% below its all-time closing high. Now this is nothing more than -1.0%. But wait, it gets funnier.
- “The Stock Market Has a 10% Chance of a 30% Crash in 2026.” Since when was a 30% correction deemed a crash? More accurately, we’d opine — by employing the lost art of proper portfolio theory in concert with the S&P’s “live” price/earnings ratio of now 55.8x — that the stock market has a 100% chance of a 50% crash in 2026.
Rightly or wrongly either way, here’s some more metrics to consider.
The Gold Stack (Continuous Contract Pricing)
- Gold’s All-Time Intra-Day High: 4410 (Dec. 18, 2025)
- 2025’s High: 4410 (Dec. 18, 2025)
- 10-Session directional range: up to 4410 (from 4199) = +211 points, or +5.0%
- Trading Resistance: Per the Profile, 4410
- Gold’s All-Time Closing High: 4374 (Oct. 20, 2025)
- Gold Currently: 4369. Expected daily trading range [“EDTR”]: 66 points
- Trading Support: Notable levels include 4369, 4359, 4336, 4304, 4263, 4236
- 10-Session “volume-weighted” average price magnet: 4313
- The Weekly Parabolic Price to flip Short: 4014
- Gold’s Fair Value per Dollar Debasement, (from our opening “Scoreboard”): 3896
- The 300-Day Moving Average: 3295 and rising
- 2025’s Low: 2625 (Jan. 6, 2025)
- The 2000’s Triple-Top: 2089 (Aug. 7, 2020); 2079 (March 8, 2022); 2085 (May 4, 2023)
- The Gateway to 2000: 1900+
- The Final Frontier: 1800-1900
- The Northern Front: 1800-1750
- On Maneuvers: 1750-1579
- The Floor: 1579-1466
- Le Sous-sol: Sub-1466
- The Support Shelf: 1454-1434
- Base Camp: 1377
- The 1360s Double-Top: 1369 in April of 2018 preceded by 1362 in September of 2017
- Neverland: The 1290s
- The Box: 1280-1240
A merry metals' Christmas to everyone.
More By This Author:
Gold Sinks Slightly As Silver Skirts SixtyGold’s New Short Trend Shoved Aside; Silver’s Rise To All-Time Highs
Gold Flies, Silver Highs … Both Into End-Of-Week Demise


