

Image Source: Pexels
We opined on Friday that bond and stock traders appeared to listen rather selectively to Chairman Powell’s address. This morning’s reaction, where those markets have largely retraced Friday’s moves, seems more in line with the full tone of those comments. Our perspective was:
In the market’s current mindset, the acknowledgment of a restrictive policy is a good thing.Never mind that it is hardly restricting investment in stocks and now bonds, and that the most recent reading of third-quarter GDP was 5.2%, the prevailing sentiment is that the Fed has a predilection for moving rates back to a neutral, if not accommodative stance.Thus, rate cuts.
The full text of the speech offers little else indicating an immediate move toward rate cuts.He led with the now-standard boilerplate about being prepared to tighten further, even if no one seems to take it seriously.But Powell reiterated more than once that 3%, or even 2.5%, is not 2%
We also acknowledged that the stock market’s reaction could have been abetted by seasonal factors:
While it was entirely possible that the move higher in equities was inevitable, considering that today is both the first of the month and a Friday (we’ve discussed options traders’ ability, if not propensity, to shove markets higher on Fridays), the sharp reversal in bond yields seems more linked to Powell’s speech.Whether it was actual enthusiasm about Powell’s speech or simply a relief that it wasn’t bad news, we see yields about 6-8 basis points lower after being up by about 3-4bp earlier this morning.
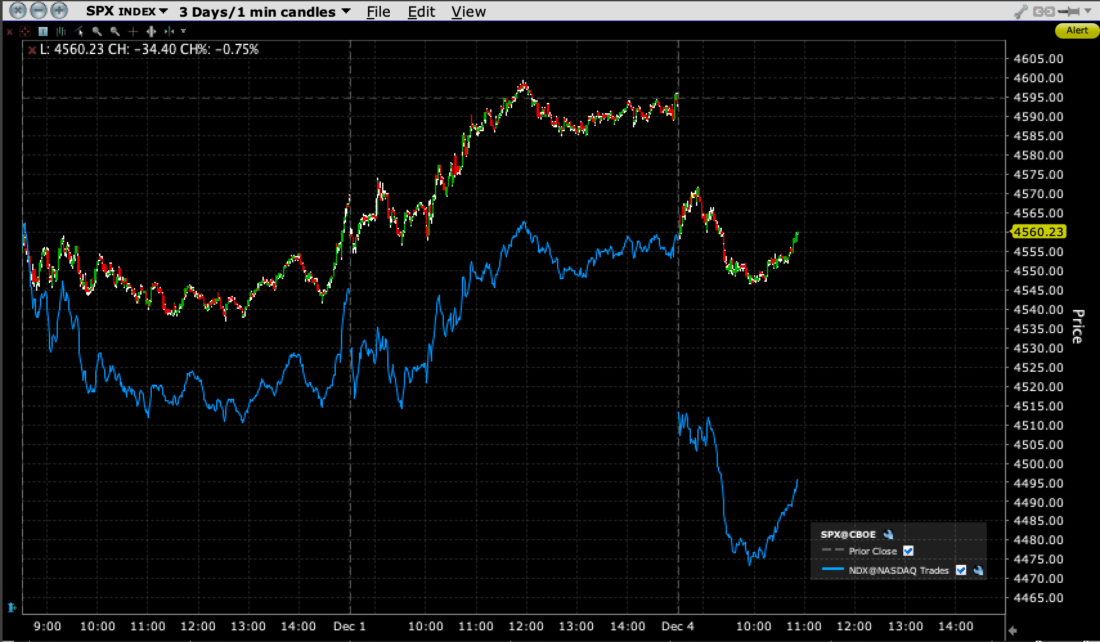
Stocks rose throughout the afternoon as bonds continued their advance. Indeed, Fed Funds futures went from pricing in a 53% chance of a rate cut by March to 75%, and the expectation for December 2024 went from 4.19% to 3.99%. Again, this was when there was no explicit indication that rate cuts were planned for the near future. This morning we see about half of those expectations retraced, with March showing a 65% chance of a cut and December priced at 4.10%. Treasury note yields gave back the bulk of their gains as well, with the 2-year yield going from 4.68% on Thursday to 4.54% on Friday, to 4.65% just before midday. The 10-year yield went from 4.33% to 4.2% to 4.29% over that same period. Meanwhile, we see the S&P 500 (SPX) retracing roughly all of Friday’s gains, with the NASDAQ 100 (NDX) well below even Thursday’s lows:
3-Day Chart, SPX (red/green 1-minute candles), NDX (blue line)
(Click on image to enlarge)
Source: Interactive Brokers
Today’s underperformance of NDX can be explained by the fact that the Magnificent Seven stocks are all lower today. We might expect them to be lower on a day when yields are higher, but there is some stock-specific news today as well. Meta Platforms (META) is lower on reports that Mark Zuckerberg will be selling shares for the first time in two years. Quite frankly, why shouldn’t he? He and his wife have extensive charitable interests, and his stock has nearly doubled this year.
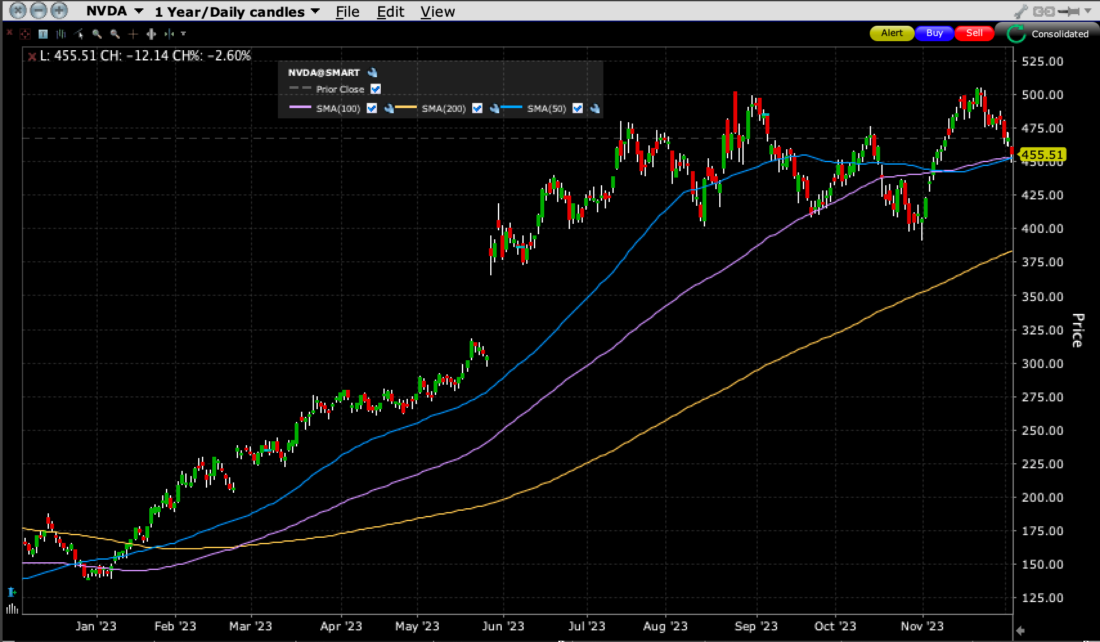
I find the movement in Nvidia (NVDA) to be the most interesting of the bunch. The stock failed to rally after its recent earnings blowout and has been on a bit of a downtrend since then. After a fall of more than -3%, NVDA found support at the $450 level, which happens to be roughly the levels of both its 50 and 100-day moving averages. As we can see from the chart below, the 50-day provided a rough basis for this year’s uptrend, while the 100-day provided solid support in late September.
NVDA 1-Year Daily Candles with 50-Day (blue), 100-Day (purple), and 200-Day (yellow) Moving Averages
(Click on image to enlarge)
Source: Interactive Brokers
While I am loath to put too much emphasis on a single stock and a couple of moving averages, this is a key test not only for NVDA but the market as a whole. If current levels fail to hold, a drop to the $400 range is not out of the question. Considering NVDA’s heavyweight in key market capitalization-weighted indices and even greater weight in investors’ current mindshare, a further 10% drop in the stock could have ramifications beyond just that one issue. Heck, this morning we saw indices bounce when NVDA did.
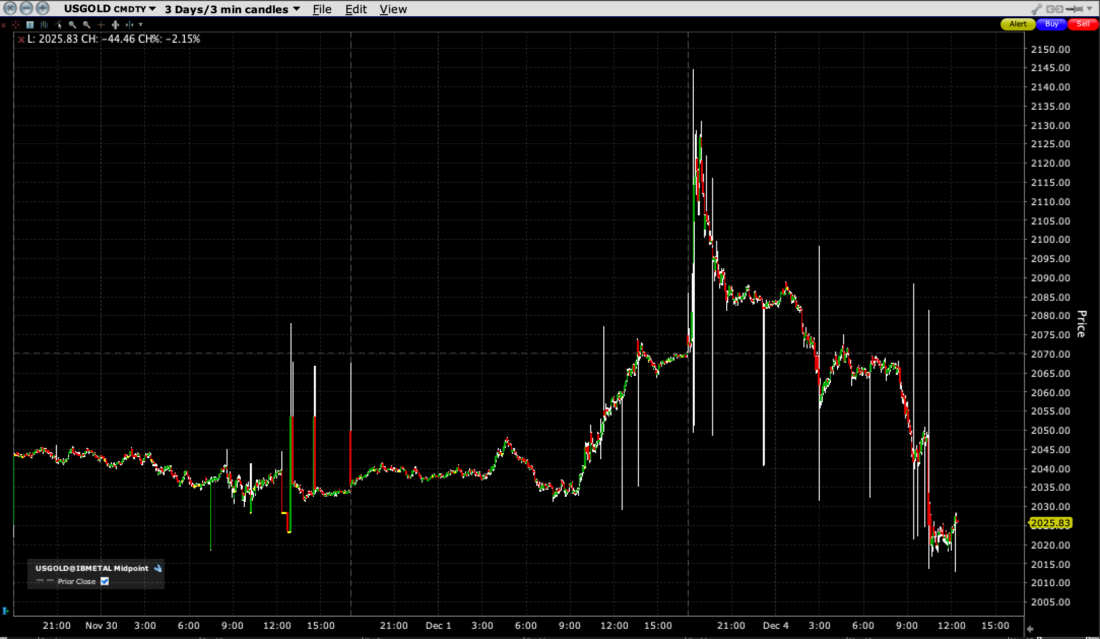
Finally, I’d be remiss if we didn’t highlight one of the stranger moves in the last 24 hours. Gold had a huge rally overnight, breaking out to new all-time highs (in USD terms) before giving back all its gains and then some:
Spot Gold, 3-Day Chart, 3-Minute Candles
(Click on image to enlarge)
Source: Interactive Brokers
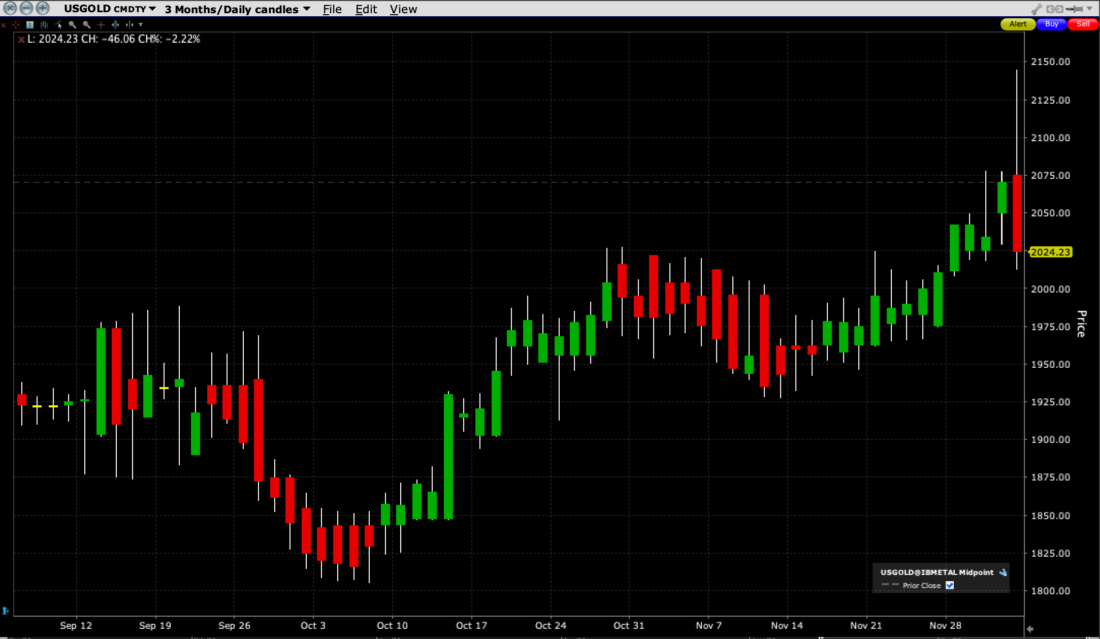
The reversal is quite stunning if we look at it as a daily candle:
Spot Gold, 3-Month Chart, Daily Candles
(Click on image to enlarge)
Source: Interactive Brokers
That is one heck of bearish engulfing reversal. The breakout was said to have been triggered by stop-loss orders in Asian hours, but there was clearly no follow-through. Today’s dollar strength, helped by higher yields, certainly isn’t helping the gold price right now. “Digital gold” is zooming, as enthusiasm for potential bitcoin-ETF listings take on a life of their own (perhaps setting up a classic “buy-the-rumor, sell-the-news” event), but the older yellow metal is failing to keep pace.
More By This Author:
Traders Hear What They Want From Powell
FOMO Is Back, Baby
Selective Listening Among Dueling Fed Speak


Comments
Log in or sign up to join the conversation.