
Liquefied Natural Gas Growth Faces Few Headwinds
Exxon Mobil (XOM) is not typically associated with Liquefied Natural Gas (UNG) but they are planning to double the volumes they handle by 2030, to 40 million tons pa.

This would be equivalent to around 5.3 Billion Cubic Feet per Day (BCF/D). The US currently exports around 12 BCF/D although that will grow as new LNG export capacity is developed. XOM is a JV partner in the Golden Pass LNG Terminal in Sabine Pass, LA along with Qatar Energy. They have ownership stakes in LNG infrastructure around the world including in Qatar, Papua New Guinea and Wales. They plan to partner with Qatar Energy to build liquefaction facilities in Texas and Qatar.
From natural gas production to liquefaction, marketing and regassification, XOM is planning to play a role throughout the value chain. Like us, they expect strong long term demand growth. Asia has historically been the leading destination for LNG trade, but Russia’s invasion has created new demand from Europe.
XOM sponsors a cool interactive map that shows where all the world’s LNG infrastructure is located and provides information about ownership, volumes etc.
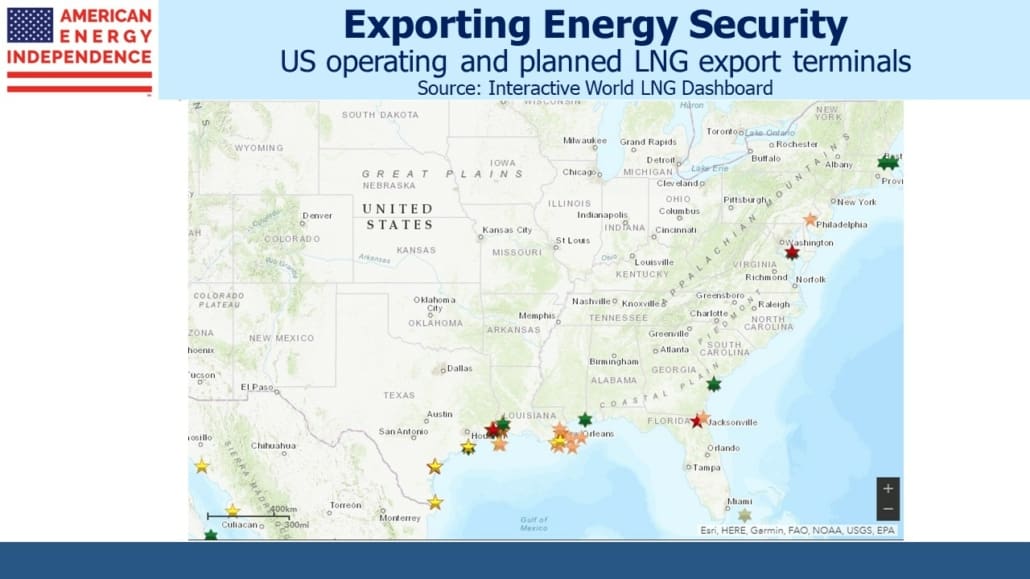
The US is largely an LNG exporter. The red stars on the US map are operating liquefaction terminals. Yellow and orange are at various stages of planning or construction. The US does import LNG, most famously in Boston (see two adjacent green stars) to compensate for the impediments they’ve imposed on natural gas pipelines (see Why Liberal States Pay Up For Energy).
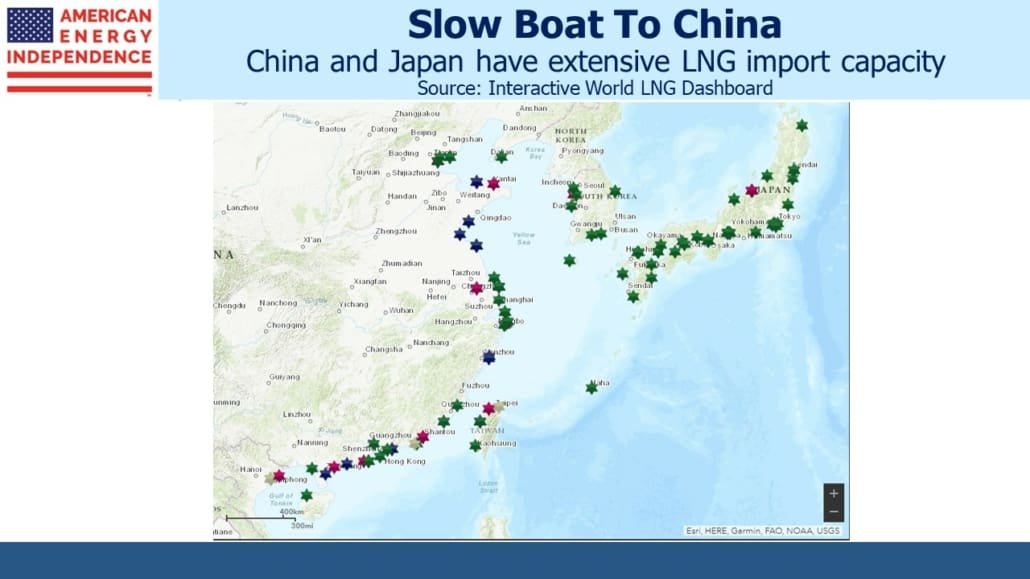
The map of China and Japan shows an extensive network of regassification facilities (green stars). The red stars and other colors in this chart are, confusingly, import terminals under construction not LNG export terminals as on the US map. If you examine the maps very closely you’ll see that five-pointed stars denote LNG export and a Star of David denotes import, regassification. But the overall picture is that Japan can import LNG at many points along its coast. China has well over a dozen import terminals under construction. China is likely to displace Japan this year as the world’s biggest LNG importer.
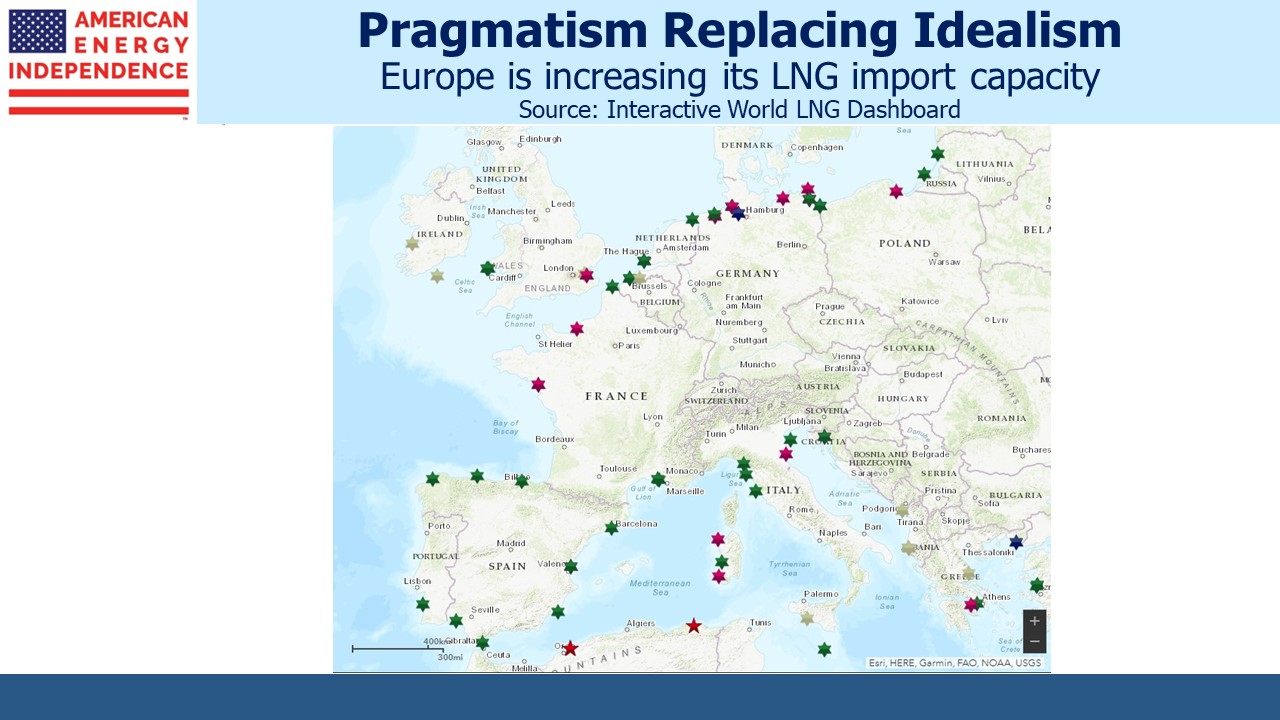
The map of Europe shows that most of the LNG import terminals are in southern Europe. Germany wasn’t able to rely on these to replace Russian imports because Europe hasn’t invested in pipelines to move natural gas north. France has long opposed building a pipeline across the Pyrenees. European energy policy was never concerned with energy security and always assumed natural gas demand would drop. Germany quickly set about building regassification facilities on its north coast and has several more planned. European gas demand has been falling, but that’s partly because manufacturing businesses are transferring production to countries that can provide energy that’s reliable and cheap. Dutch fertilizer company OCI is investing $1BN in a Texas ammonia plant than will access cheap local natural gas, and then earn Inflation Reduction Act tax credits by sequestering the CO2 by-product underground (see Sending More Carbon Back Underground).
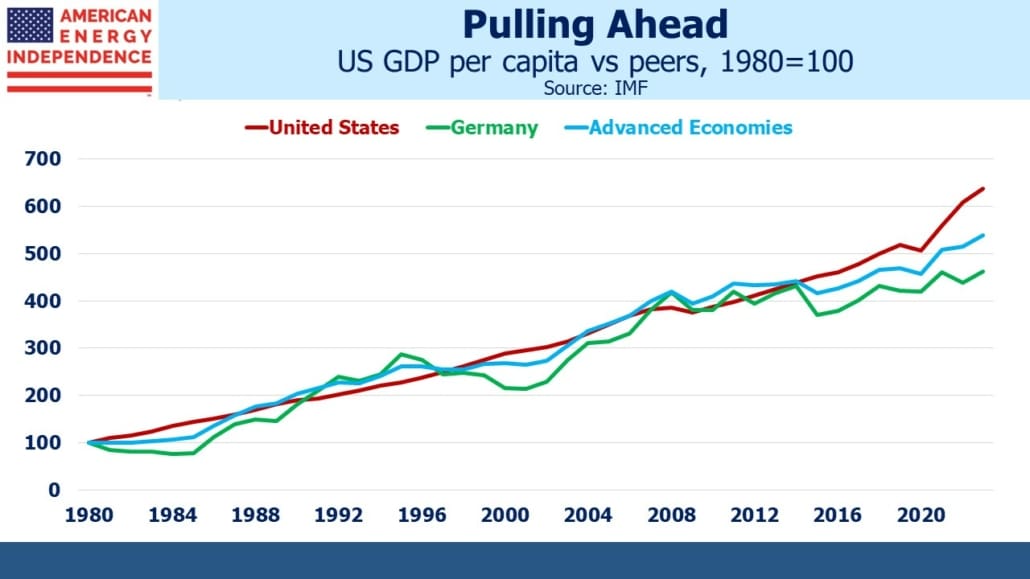
America’s per capita GDP has steadily pulled away from Germany’s and other advanced countries, most notably over the past decade or so (see Celebrating The 4th of July). We can all find much to criticize about our politicians, but at least government gets in the way less here than in other countries.
Cheniere exports around half of America’s LNG. They’re considering adding a new pipeline in Louisiana to add supply flexibility to their export terminal. Natural gas is a cleaner substitute for coal, and China’s growing LNG imports offer the hope that they will at some point reduce their industrial use of coal. Ship owners are also investing substantial sums to use LNG. In most cases this is replacing bunker fuel which is highly pollutive and is being phased out via global environmental regulations.
New windpower continues to face spiraling costs. The UK has made good use of the blustery North Sea, but Sweden’s Vattenfall recent halted work on a project intended to power 1.5 million UK homes because the cost has risen 40%. “What we see today, it simply doesn’t make sense to continue this project,” said Vattenfall chief executive Anna Borg.
Vattenfall took an impairment charge of $537MM. Evidently the UK government declined to adjust the terms of the contract to allow work to continue. By contrast, NJ governor Phil Murphy when faced with a similar problem recently redirected Federal tax credits worth up to $1BN to Danish firm Orsted so they can continue to build wind turbines along the NJ coastline (see Environmentalists Opposed To Windpower).
When contemplating the prospects of LNG versus windmills, we always take the former.
More By This Author:
Environmentalists Opposed To Windpower
Stocks Aren’t Cheap
Situations We’re Following
Disclosure: We are invested in all the components of the American Energy Independence Index via the ETF that ...
more

