

Image Source: Pixabay
Gold prices continue to show strength. The market is reacting to multiple global events. Investors are turning to gold as a safe haven. This comes amid geopolitical instability and shifting trade policies. The technical chart also points toward a major bullish breakout. Rising inflation concerns and central bank buying further support the rally. Uncertainty around interest rate direction adds to gold’s appeal.
Trump’s Trade Signals and Global Conflict Boost Gold Appeal
Gold prices remain strong due to global uncertainty. Investors seek safety amid trade tensions and geopolitical risks. US President Donald Trump's unpredictable trade policies create doubt. His recent hints at new deals offer mixed signals. Markets react cautiously, keeping demand for gold high.
The Russia-Ukraine war continues to escalate. Fresh attacks and drone strikes heighten fears. Middle East tensions add more pressure. These conflicts boost gold’s appeal as a safe-haven asset. Despite some positive US data, the global risk tone remains fragile. This keeps buyers interested in gold.
The US Dollar struggles to recover. Easing recession fears helps the dollar slightly. But investors still prefer gold. The upcoming FOMC meeting adds uncertainty. Traders wait for policy clarity before making bold moves. Until then, gold stays supported by fear and weak dollar momentum.
Gold Breaks Multi-Year Resistance, Signals Long-Term Bull Trend
The monthly chart for gold shows a powerful technical pattern emerging in the XAU/USD pair. A clear “inverse head and shoulders” pattern has formed over several years. The neckline of this pattern was tested multiple times between 2020 and 2023. Each attempt failed—until early 2024.
The neckline sits around the $2,075 level. The chart shows three distinct troughs—one each in 2021, 2022, and 2023. These lows form the left shoulder, head, and right shoulder of the reversal pattern. After forming the right shoulder in late 2023, gold surged higher.
(Click on image to enlarge)
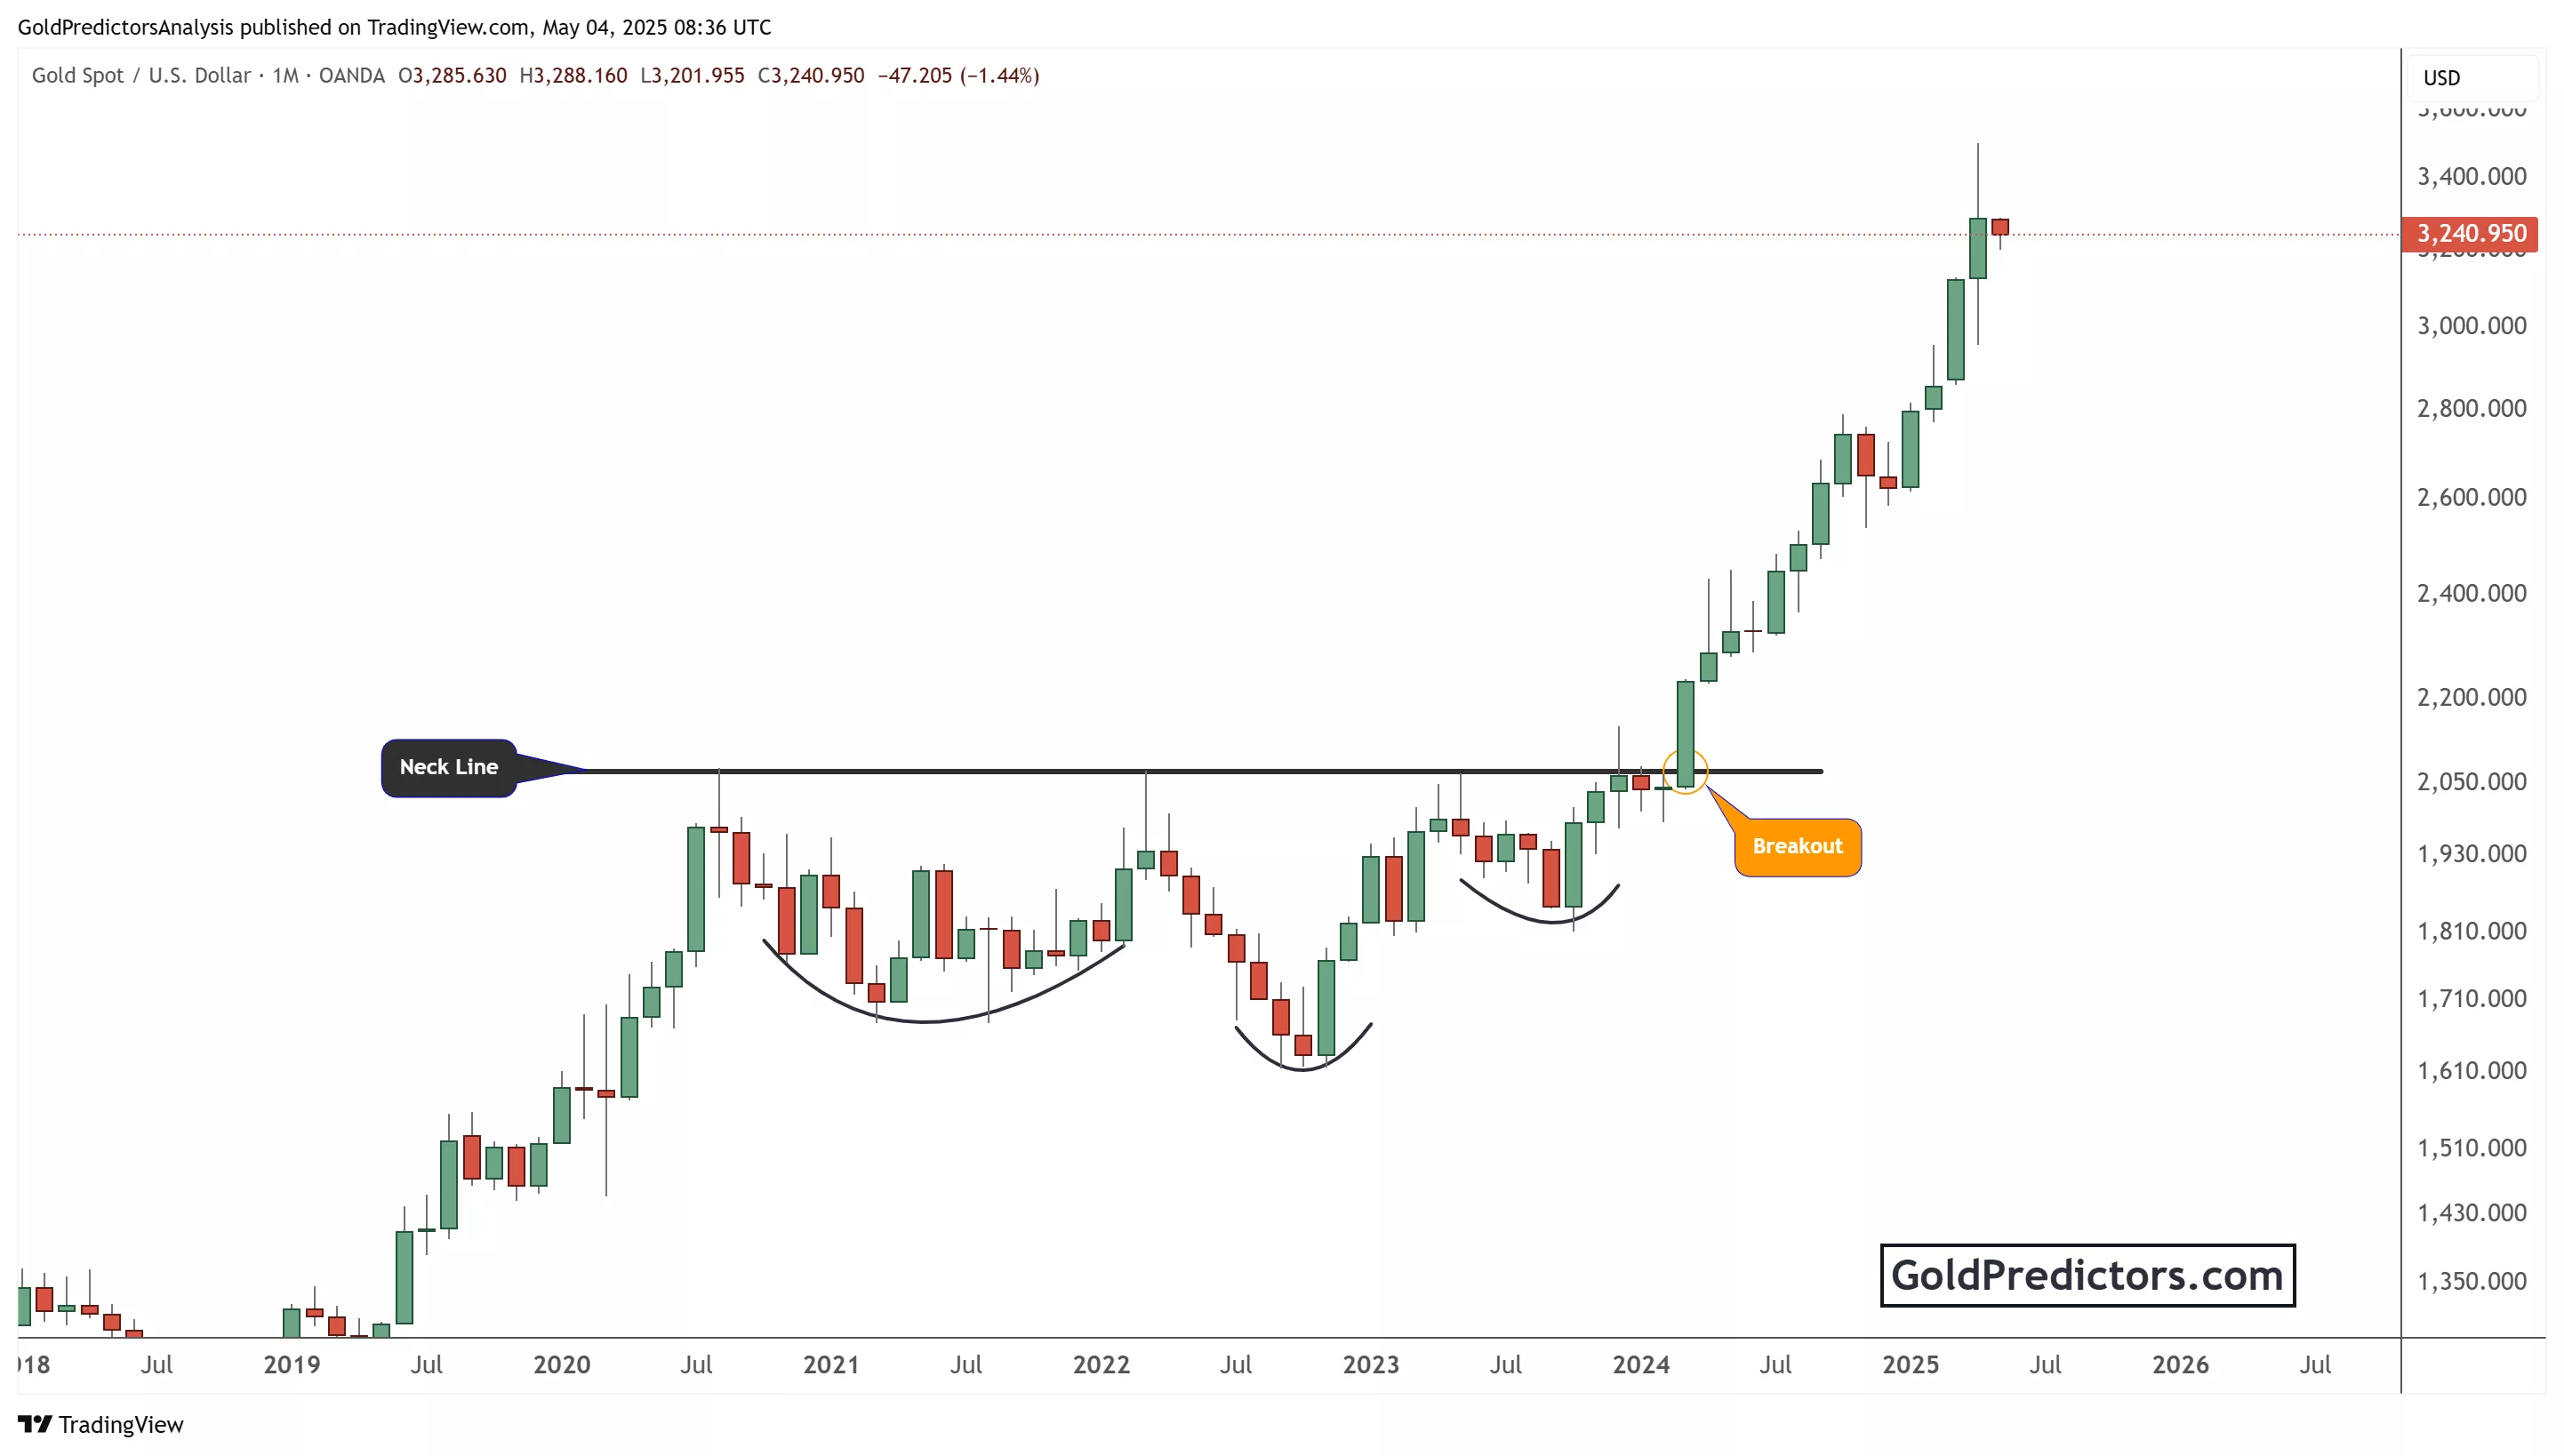
A confirmed breakout occurred in early 2024. The breakout candle closed well above the neckline, signaling strong bullish momentum. Since then, gold has rallied sharply, reaching above $3,200 per ounce. This marks a historic high in gold prices.
The pattern suggests a long-term trend reversal. Gold had consolidated below the neckline for years. Once it broke through, momentum took over. Technical traders see this as a textbook breakout scenario. The upward price movement has been strong and steady since then.
Volume often confirms such patterns. Although volume isn’t shown here, the price action suggests strong buying pressure. Breakouts from multi-year patterns often lead to extended moves. That is exactly what this chart reflects.
Conclusion
Gold price (XAU/USD) holds firm near a two-week high. Safe-haven demand stays strong amid ongoing geopolitical tensions and uncertain US trade policies. Weakness in the US Dollar also supports gold. However, hopes for easing US-China trade tensions cap further gains. Traders remain cautious ahead of the upcoming FOMC decision. Persistent risks from the Russia-Ukraine war and Middle East unrest keep investors on edge. Gold remains a preferred hedge against global instability. Recent US economic data also fail to lift the dollar meaningfully, reinforcing gold’s bullish tone.
More By This Author:
Gold Price Drops On Technical Resistance And Market Optimism
Gold Rally Gains Strength On Trade Developments And Fed Signals
Gold Struggles To Hold Gains As Uncertainty Grips Global Markets


Comments
Log in or sign up to join the conversation.