

Image Source: Pixabay
Gold prices are facing a sharp pullback after reaching a historic peak. The precious metal is losing momentum due to a combination of technical resistance and improving global sentiment. Gold is currently trading lower after recently reaching a new all-time high earlier this year. Several market forces are contributing to the recent downside pressure. Traders are now watching closely for signs of stabilization or a deeper correction.
Gold Drops despite Recession Risks and Fed Cut Expectations
Gold prices continue to decline as global market sentiment improves. Investors feel more confident due to easing trade tensions between the US and China. US President Donald Trump’s optimistic comments on potential trade deals with other countries further support risk appetite. As a result, safe-haven demand for gold weakens, leading to a three-day price decline.
The US Dollar strengthens on the back of positive sentiment and fresh buying interest. Stronger USD weighs on gold since the metal is priced in dollars. A technical breakdown below the $3,260 support level triggers additional selling. Investors reduce exposure to gold as the Dollar regains traction. This move coincides with upbeat commentary and short-term data surprises.
However, economic concerns still linger beneath the surface. US GDP data shows a surprise contraction in Q1 2025, raising fears of a recession. Inflation pressures are easing, and markets expect aggressive rate cuts by the Federal Reserve. These factors could limit further USD gains and offer support to gold. For now, gold remains under pressure, but a shift in Fed policy could revive bullish momentum.
Technical Analysis: Gold Forms Bearish Setup after Channel Extension
The daily chart for gold shows a clear technical picture, indicating that gold has been in a strong uptrend for several years. A major breakout from an ascending triangle pattern in 2019 triggered a long-term rally. The price surged past key resistance zones and continued its bullish run.
After a period of sideways movement, gold formed an ascending channel starting in late 2022. This structure guided prices steadily higher. The price followed the channel closely until breaking above the upper boundary in early 2025. This breakout was classified as an extension move, typically signaling overbought conditions.
(Click on image to enlarge)
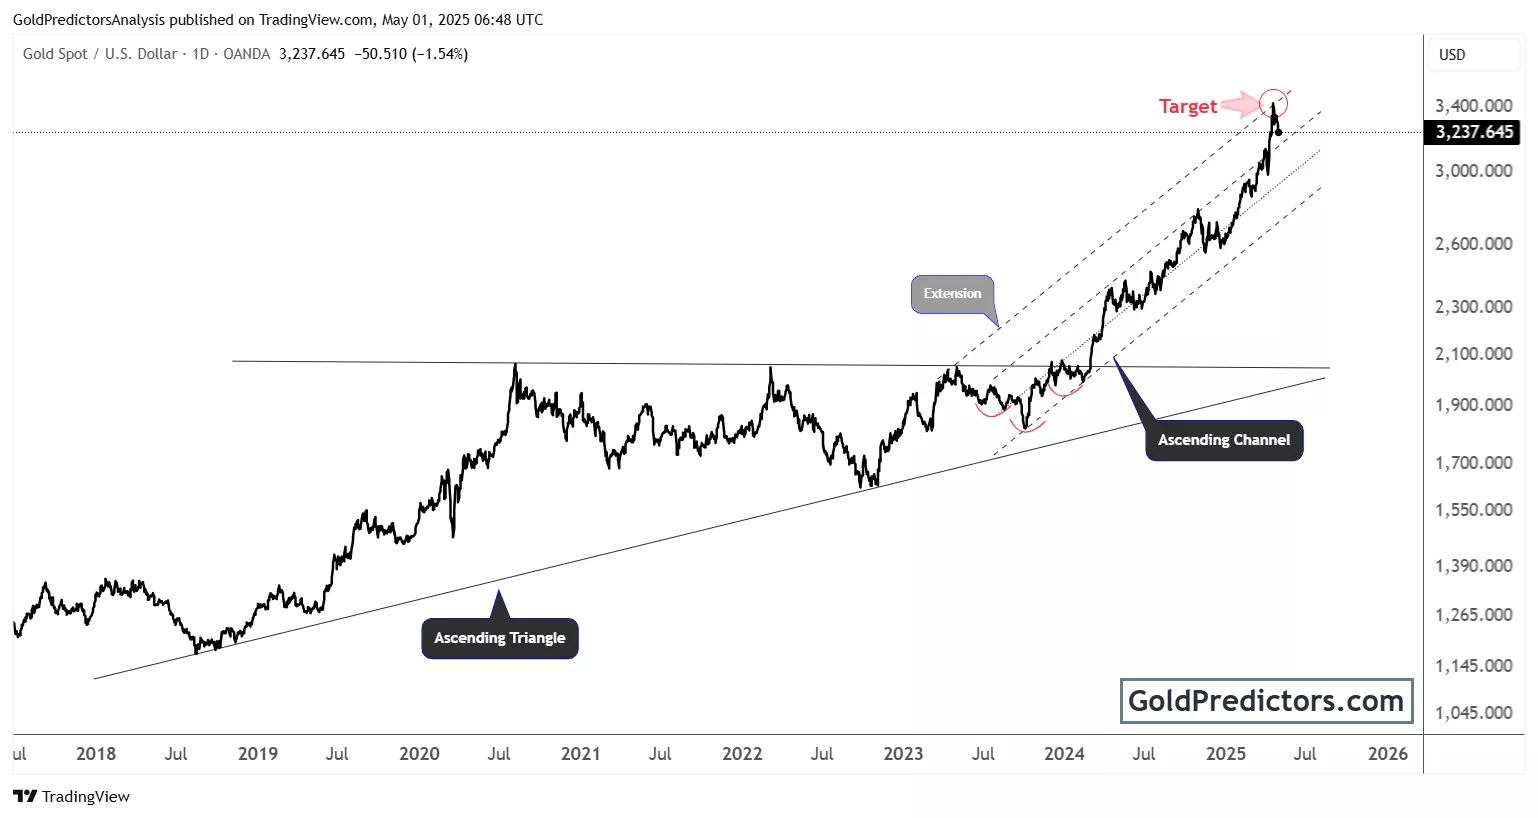
A target zone near $3,500 was marked, which the price touched before reversing. This zone represented the top of the bullish channel extension. The price failed to maintain momentum above this level, resulting in a strong rejection.
Now, gold is pulling back toward the lower portion of the ascending channel. Technical indicators suggest the metal is in a correction phase. A breakdown below $3,260—clearly noted in the chart—triggered additional selling pressure. This area acted as a pivotal support.
The pattern shows a potential for further downside unless buyers reclaim key support. If the price breaks below the midline of the channel, more losses could follow. Traders should watch for signs of consolidation before anticipating any new upside.
Conclusion
Gold (XAU/USD) remains under pressure, holding just above a recent two-week low. Easing US-China trade tensions and continued USD strength weigh on the safe-haven metal. A surprise US GDP contraction and cooling inflation have boosted expectations of Fed rate cuts, which may limit USD gains and support gold. Still, more selling is needed to confirm a near-term top and extend the pullback from recent highs.
More By This Author:
Gold Rally Gains Strength On Trade Developments And Fed Signals
Gold Struggles To Hold Gains As Uncertainty Grips Global Markets
Gold Prices Rebound Amid Trade Tensions And Market Uncertainty


Comments
Log in or sign up to join the conversation.