

Image Source: Pixabay
Gold prices are once again in focus. After a brief pullback, the precious metal is climbing higher. Tensions in global trade and investor uncertainty are driving the move. Technical patterns also point to significant developments ahead. These signals offer valuable insight into gold’s next potential move.
Global Trade and Policy Shifts Drive Gold Higher
Gold prices recovered as global trade uncertainty resurfaced. President Trump’s recent comments signaled new tariffs on China within weeks. This news reignited fears of trade tensions, prompting investors to seek safe havens like gold. As talks stall, risk sentiment weakens and gold benefits.
US Treasury Secretary Scott Bessent confirmed the administration’s firm stance. He emphasised that no unilateral tariff reductions are planned. Bessent also pointed to broader concerns, including subsidies and non-tariff barriers. This reinforced the market's belief that trade friction with China may persist.
Meanwhile, China’s gold markets faced dual selling pressures. Investors rushed to take profits after gold's rally and Trump’s tariff threats. However, central bank support and solid long-term demand remain strong. Trading firms still see healthy buying, suggesting that investor interest in gold is intact.
Technical Analysis: Gold Breaks Out of Ascending Broadening Wedge
The weekly chart for gold shows a clear ascending broadening wedge. This is a bullish pattern that often appears during uptrends. It consists of two diverging trend lines—one support and one resistance. Price bounces between them before eventually breaking out.
Since 2016, gold has followed this wedge pattern. Each bounce within the pattern has formed identifiable reversal structures. These include cup-and-handle shapes, which are typically bullish.
(Click on image to enlarge)
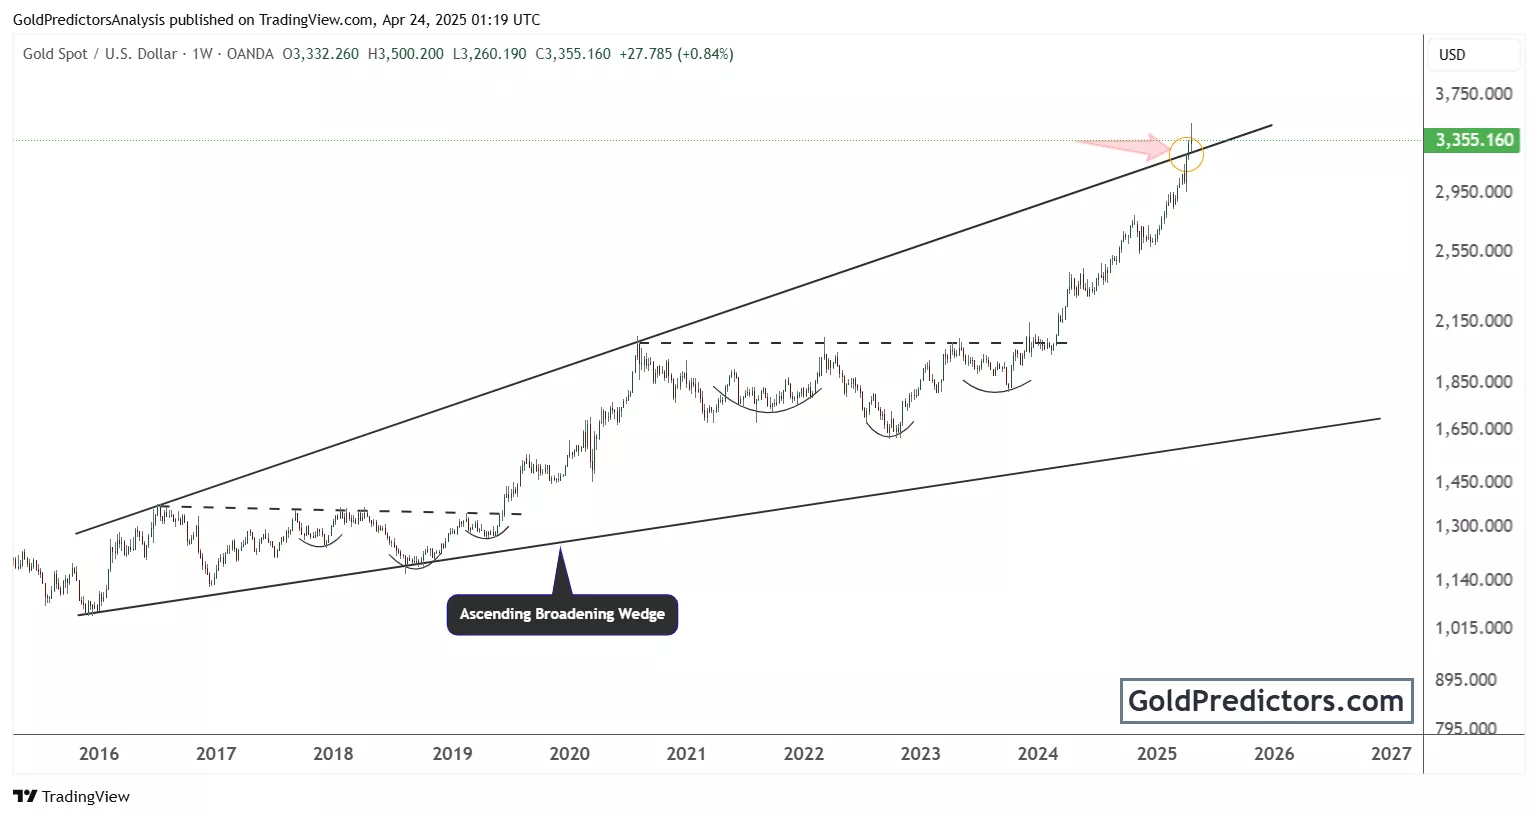
By early 2024, gold broke through key horizontal resistance. That breakout triggered a steep upward rally. The price accelerated past $3,300, reaching as high as $3,500.
This move pushed the price briefly above the upper wedge boundary. This kind of breakout suggests aggressive bullish sentiment. However, the price has since corrected slightly, hinting at short-term exhaustion.
The area marked with a yellow circle and red arrow in the chart signals a potential reversal or pause. Traders often take profit at such points. Still, the overall uptrend remains intact, provided the price stays above previous resistance levels.
Conclusion
Gold remains strong despite recent pullbacks. Trade tensions and policy signals continue to fuel demand. Technical patterns support the bullish outlook. The breakout from a long-term wedge pattern suggests continued strength. Even after short-term corrections, gold holds above key support levels. Central banks and trading firms show ongoing interest in gold. That interest reinforces long-term confidence in the metal. As uncertainty around global trade and economic policy grows, gold stays in focus. Investors see it as a haven in times of volatility. Both price action and market sentiment suggest that gold may climb further in the months ahead.
More By This Author:
Gold Hits New Record High As Fed Independence Comes Under Pressure
Gold Holds Strong After Record Highs: What’s Next For The Precious Metal?
Gold Corrects After All-Time High As Safe-Haven Demand Softens


Comments
Log in or sign up to join the conversation.