

Image Source: Unsplash
Gold prices have stayed strong after reaching a record high earlier this month. Investors decided to secure profits ahead of the Easter weekend, causing a minor pullback. Still, gold remains a safe haven in times of uncertainty. With rising concerns over global tensions and US trade policies, gold's appeal continues to grow. On the other side, the Federal Reserve’s hawkish stance and mixed economic data could put pressure on the precious metal.
How Geopolitics and Fed Policy Are Shaping Gold’s Investment Case
Gold prices are showing strength despite a recent pullback. Investors booked profits after gold reached a new high of $3,358. However, safe-haven demand remains strong. Uncertainty around U.S. trade policies and global tensions continues to support gold. Concerns over President Trump's tariffs and geopolitical risks make gold more attractive.
At the same time, the U.S. economy is giving mixed signals. Jobless claims dropped, showing some strength in the labor market. However, housing starts declined, and inflation fears are rising. Fed Chair Jerome Powell turned hawkish, suggesting no rate cuts in June. This boosted the U.S. dollar, which can limit gold's upside in the short term.
Despite this, markets expect rate cuts later in the year. Money traders have priced in 86 bps in cuts by the end of 2025. This outlook may weaken the dollar and help gold rise further. Gold also benefits from stagflation concerns. If the economy slows while inflation stays high, gold demand could grow. Fundamental factors continue to support gold in the long run.
Gold Technical Analysis: Inverted Head and Shoulders Breakout Fuels Bullish Momentum
The quarterly chart for gold gives a clear long-term view. In the first phase (2013–2019), Gold built a base. The rounded bottoms show investor accumulation. The neckline of the inverted head and shoulders served as resistance until the 2019 breakout.
After the breakout, the price quickly climbed to new highs. It reached a temporary peak and then moved sideways in a narrowing wedge. This pattern signaled consolidation before the next move. A breakout from this wedge occurred in Q4 2023, confirming a new bullish wave.
(Click on image to enlarge)
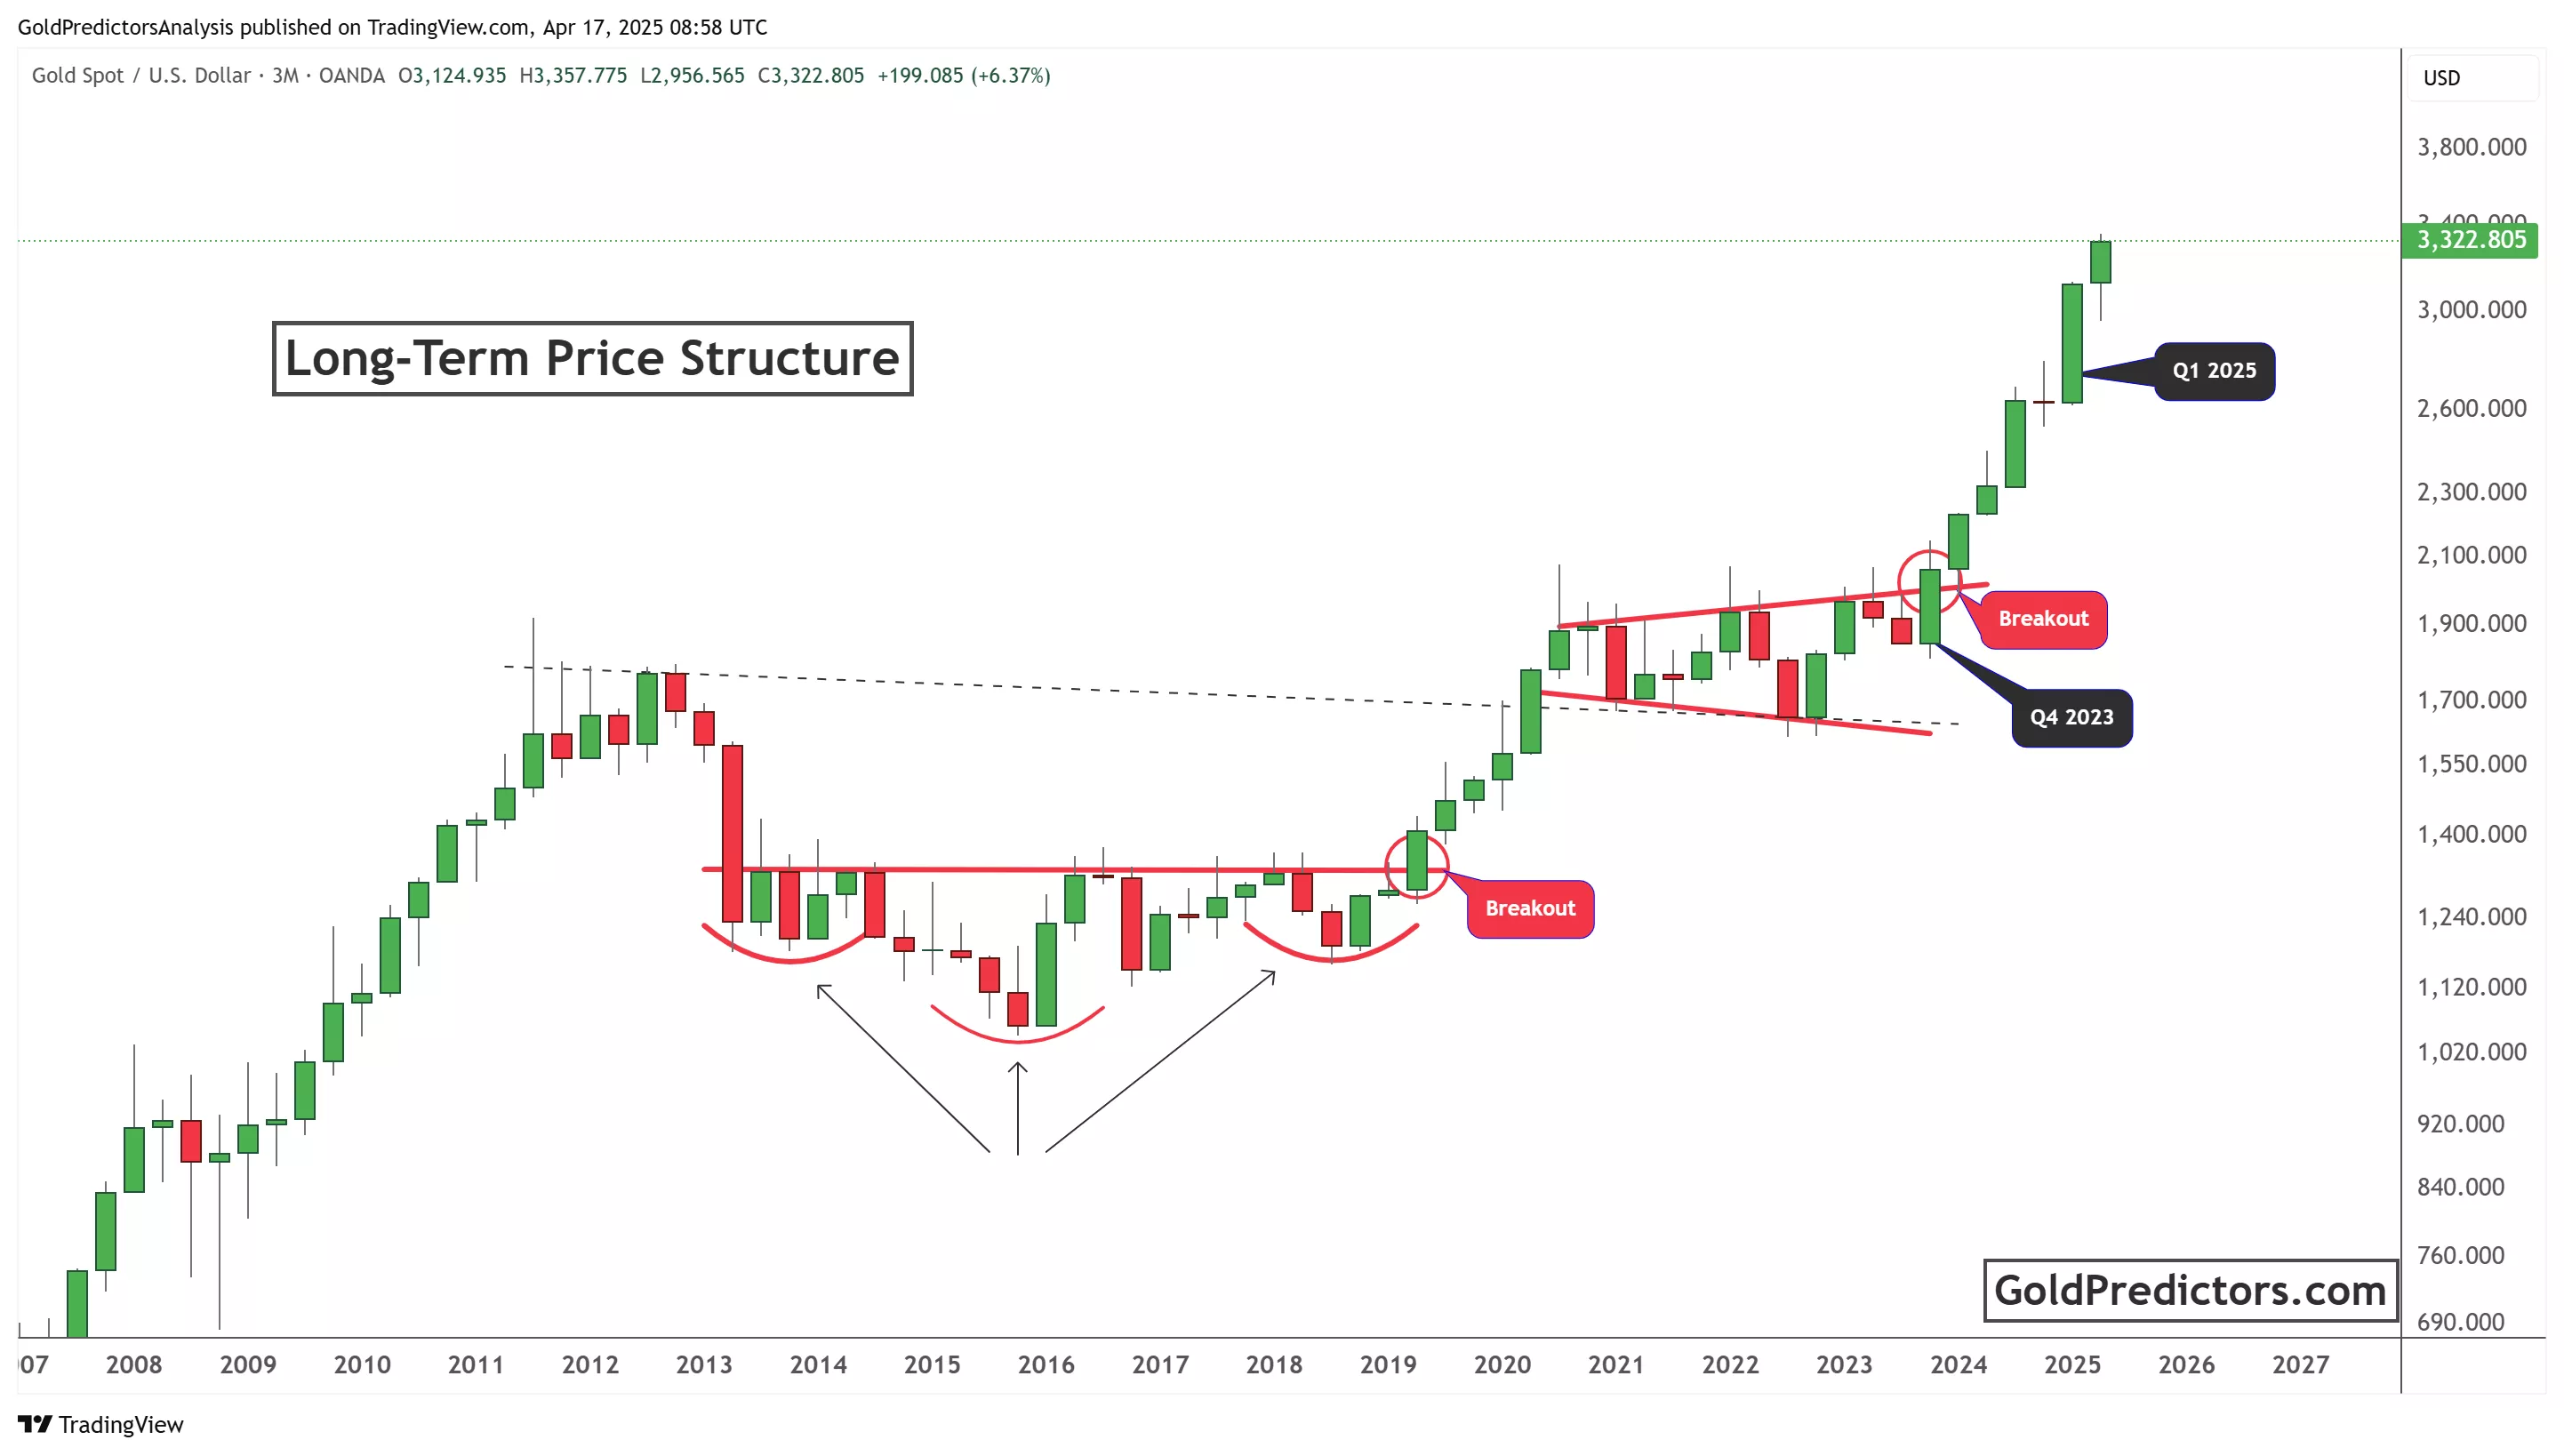
The candles after the breakout are large and green, showing strong buying pressure. The current candle for Q1 2025 is also bullish, with gold trading around $3,322. The technical structure remains strong. Support lies around $2,100–$2,200 — the zone of the breakout.
This long-term setup suggests that gold could climb even higher. As long as the pattern of higher highs and higher lows continues, bulls remain in control.
Conclusion
Gold prices are holding steady after a record-breaking run, backed by strong long-term technical patterns. Geopolitical tension, economic uncertainty, and a cautious Federal Reserve support gold’s appeal. The chart reveals a bullish breakout structure that has triggered strong upward moves. Strong support and rising momentum may push gold higher in the coming months.
More By This Author:
Gold Corrects After All-Time High As Safe-Haven Demand Softens
Gold Surges As Trade Tensions And Fed Policy Shake Global Markets
Gold Prices Soar Past $3,100 Amid US-China Trade War Escalation


Comments
Log in or sign up to join the conversation.