

Image Source: Pixabay
Gold prices are on fire. The precious metal is trading at around $3,120. A surprising move by US President Donald Trump sparked this rally. He paused tariff hikes on 56 countries and the European Union. But in a sharp twist, he also raised tariffs on China to a massive 125%. That bold decision and China's retaliatory response ignited fears of a deeper trade war. As tensions rise, investors rush to gold—once again proving it to be the ultimate haven.
Uncertainty Reigns: Why Global Tensions Are Driving Gold Higher?
The current spike in gold is not random. It reflects growing uncertainty in global politics and economics. President Trump’s tariff shifts sent shockwaves through the markets, and investors quickly pulled money out of riskier assets and poured it into gold.
China’s response added fuel to the fire. With an 84% tariff on US imports and a deliberately weakened Yuan, the Chinese government signaled it is ready to escalate. Meanwhile, the US Treasury warned Beijing, but the damage had already been done.
Gold is up 18% this year. This sharp rise is backed by central bank buying, monetary policy shifts, and fading trust in traditional financial assets. The Federal Reserve, despite earlier hints of easing, now shows only a 19.5% chance of a rate cut in May. For June, expectations are higher at 75.3%. Still, the wait-and-watch mode has only boosted gold's shine.
Technical Analysis: A Classic Cup and Handle Breakout
The weekly chart tells a powerful story. From the early 2000s to 2011, gold moved inside a clear ascending channel, marking a long-term uptrend with higher highs and lower lows. Then came a long pause. Prices were corrected and consolidated for nearly a decade.
This consolidation formed a classic "Cup and Handle" pattern. The cup, which was shaped like a smooth curve, lasted from 2011 to around 2020. Afterward, gold formed a handle from 2020 to 2024, showing smaller corrections and consolidation within a narrowing range. This entire setup hinted at an explosive breakout.
(Click on image to enlarge)
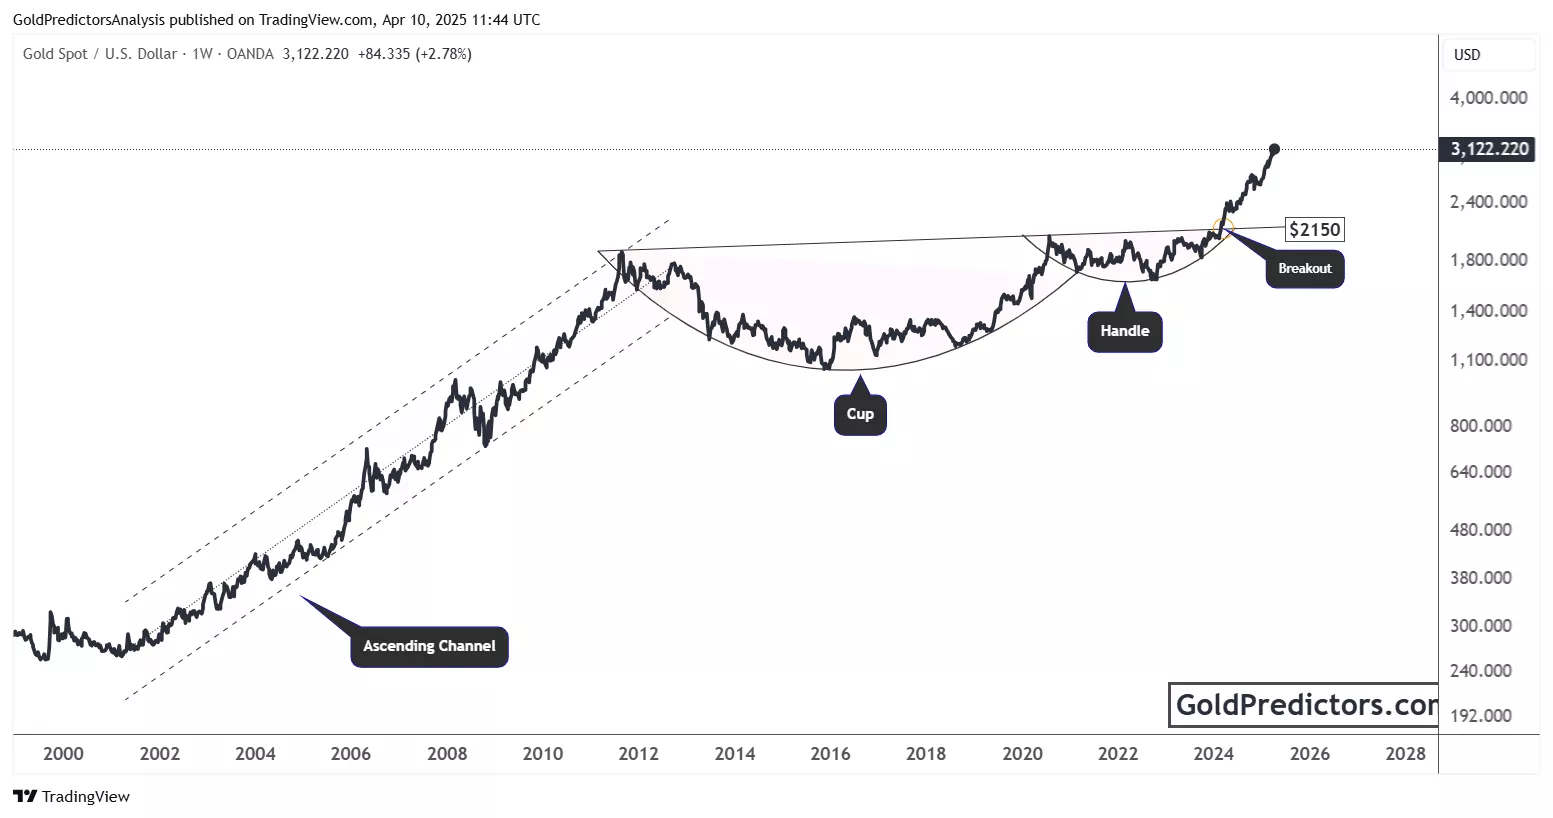
And the breakout came. Around the $2,150 level, gold shattered its long-standing resistance. It confirmed the bullish reversal; prices have surged past $3,100 since then. This pattern is one of the most reliable in technical analysis. It suggests a continuation of the uptrend with much higher targets ahead.
The volume spike and steep angle of ascent post-breakout show strong institutional interest. Investors treat this breakout as a long-term move, not just a short-term trade. The breakout zone now acts as strong support. The bull case remains intact as long as gold stays above this level.
Conclusion
Gold’s recent rally is not just about tariffs or rate cut hopes. It results from a long-term technical structure aligning with current macro turmoil. The “Cup and Handle” breakout on the weekly chart validates the momentum. Central banks, geopolitical risks, and collapsing trust in fiat currencies are all pushing gold into the spotlight. With prices above $3,100 and strong support at $2,150, gold’s journey may just be getting started. Investors looking for safety and growth will likely stay bullish on the yellow metal for the foreseeable future.
More By This Author:
Will Gold Sustain Its Rally Above $3,000? Key Technical And Macro Clues
New All-Time High: Can Gold Break The $3,100 Barrier?
Gold’s Bullish Trend Continues: Can It Hit A New All-Time High?


Comments
Log in or sign up to join the conversation.