
Gold's Path To $5,000
I'm bullish on gold, and gold is likely going much higher. The problem with gold is that the market typically underappreciates it. Thus, it floats around much of the time without a meaningful sense of direction. However, the market remembers that gold exists in specific, relatively rare instances, and prices get bid up substantially very rapidly. I think we're entering a remarkably bullish period for gold and gold miners right now.
The perfect storm of variables for gold prices
- Persistent inflation
- Perpetual easy monetary policy
- Negative real interest rates
- An extraordinarily high national debt
- A continuously expanding monetary base
- Increasingly bullish technical image
Given this landscape of favorable factors, sentiment should turn bullish for gold as we advance. This shifting dynamic will probably enable demand for gold to surge, and prices for gold and gold miners are likely going much higher.
The Market is Behind the Curve on Gold
Let's face it. Gold is an unloved asset. While the S&P 500/SPX is up by over 32% over the past year, gold is down by nearly 7%. Gold miners/VanEck Vectors Gold Miners ETF (GDX) is even worse, down by almost 19% in the same time frame.
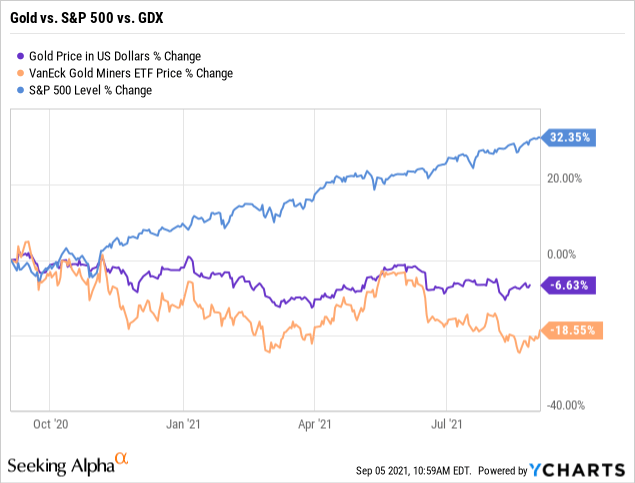
Data by YCharts
This phenomenon is nothing new, as gold and gold miners often underperform the market. Many market participants are not sure why they should own gold or gold miners. Sure, gold is shiny, it looks nice, but it does not pay a dividend, it has no earnings, no revenue growth, and no P/E ratio. People are not quite sure how to value gold either and what its ultimate use is. Consequently, many analysts are never confident in what the price of gold may look like next year or the year after that. This phenomenon is why we have quality gold mining companies trading at rock bottom valuations, as seemingly no one wants to own them right now.
So, Why Would You Want to Own Gold Right Now?
Inflation, Inflation, Inflation
The first factor we need to talk about is inflation. We're living in a time of the everything bubble, and despite the lackluster price action of late, gold remains the ultimate time-tested hedge against inflation. Prices all around us are rising continuously, and they are beginning to appreciate much faster than usual. The food in your supermarket, gas at the pump, and prices, in general, are perpetually rising and should continue to do so. The phenomenon known as inflation is the hottest it's been in decades.
CPI - Consumer Inflation
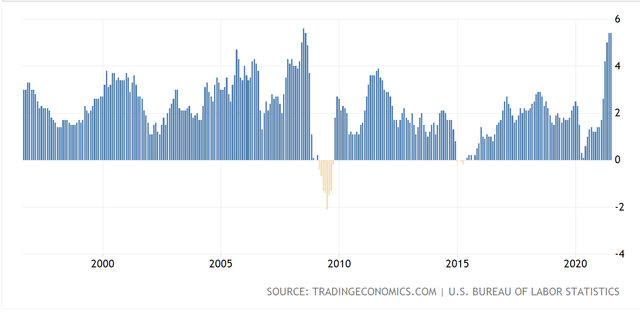
Source: tradingeconomics.com
The CPI has been coming in at around 5.5% in recent months. This level of consumer inflation is remarkably high, and we saw a similar spike only once during the last 30 years. The CPI briefly shot up above 5% right before the financial crisis of 2008 began. While this atypically high level of inflation proved to be a transitory spike, inflation should prove to be much more persistent this time. The Fed was at a concluding phase of a tightening cycle then, but the central bank hasn't even stopped easing in this cycle. Therefore, we could see inflation increase and stay elevated for longer than many market participants anticipate.
PPI - Producer Inflation
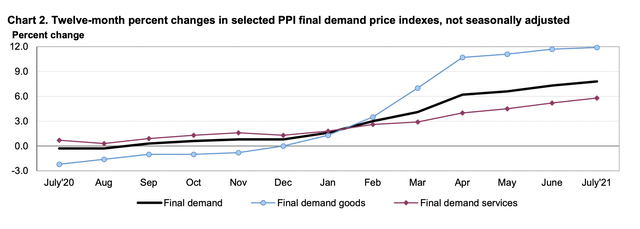
Source: bls.gov
If you think consumer inflation is high, it's nothing compared to producer inflation. PPI final demand goods hit 12% in July. This dynamic implies that, on average, producers are paying about 12% more than they did last year to bring everyday products to market. While this vast price increase is not passed down to the consumer yet, it likely will be in the future. Thus, consumer inflation is likely to go even higher as we advance.
Where is All This Inflation Coming From?
Perpetual Monetary Expansion
The Fed's Balance Sheet
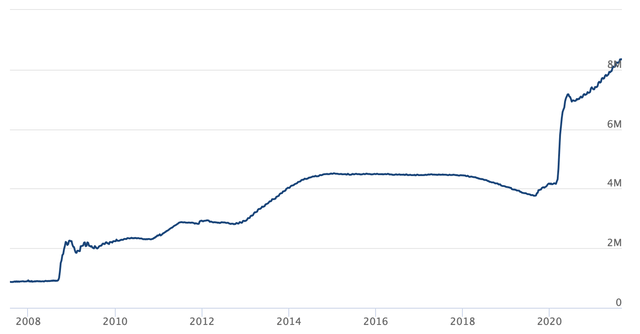
Source: federalreserve.gov
If you're wondering where all this inflation is likely coming from, look at the Fed's balance sheet. The Fed's balance sheet was about $900 billion before all the QE and bond-buying started. Now the Fed's balance sheet towers at over $8 trillion. If you're wondering why we're only beginning to see inflation tick up notably now, it's partly because of the delayed effect. It takes time for the bond-buying, backstops, and QE, in general, to materialize into inflation. Initially, the Fed's easing program provides immediate support and confidence to critical industries, the economy, and the stock market. QE programs improve sentiment in the short term, but we're now starting to witness the longer-term effects, and one of the unintended consequences is atypically elevated inflation.
U.S. Monetary Base
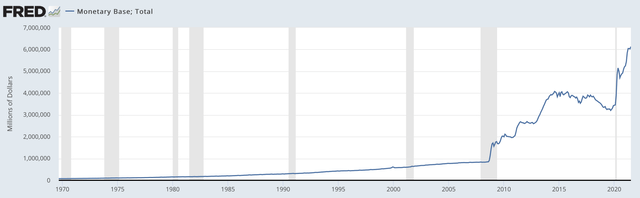
Source: fred.stlouisfed.org
We can see the same phenomenon in the U.S.'s monetary base. The base was at about $800 billion in early 2008 but has ballooned to over $6 trillion now. Incidentally, the price of gold has a close correlation with monetary base expansion. For instance, the monetary base and gold's price expanded by roughly 1,000% from the early 1970s (when the dollar became decoupled from gold) to 2008 (before the QE experiment). However, since the remarkable money creation began in 2008, the price of gold has not kept up with the monetary base.
Since around the time of initial QE, the monetary base has exploded by about sevenfold, or 600%, while the price of gold has only appreciated by roughly 125%, or slightly more than twofold in the same time frame. Again, there is probably a delayed effect here as well, much like with inflation. Now, as inflation is increasing notably, the price of gold should begin to move up substantially as well. If we use the monetary base as a proxy for gold prices, gold could hit around $5,600 to reflect a similar appreciation as the monetary base.
One reason gold has failed to appreciate as much as the monetary base is the expectation that QE will end and rates will normalize. Many market participants still believe that the Fed's balance sheet can shrink and decrease the monetary base. However, the Fed failed to normalize rates in the past, and the national debt may be too high to withstand a noticeably higher interest rate environment. Also, the economy will find it increasingly difficult to expand in a "normalized" rate atmosphere. Therefore, we may be looking at a perpetually easy monetary environment, which should prove very beneficial for gold prices as we advance.
Technical Image is Now Bullish
It has been a while since gold's technical image appeared bullish. Well, things are finally starting to look up.
Gold: 3-year chart
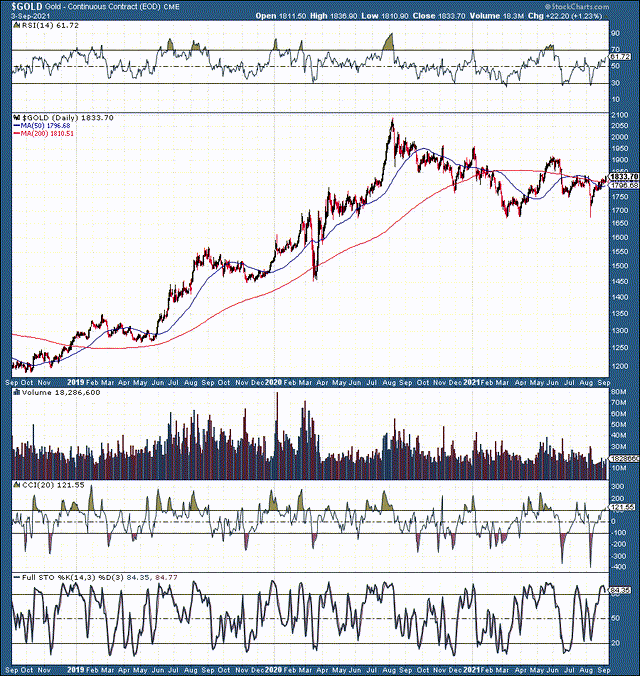
Source: stockcharts.com
Gold went through a prolonged textbook 20% correction from its peak at nearly $2,100 to its bottom at approximately $1,675. After putting in a double bottom around this support level in the spring, gold put in a retest around $1,675 in the recent flash crash last month. We can view the $1,675 level as critical support and a probable long-term bottom. Now, gold should embark on another long-term uptrend to new all-time highs.
GDX: 3-year chart
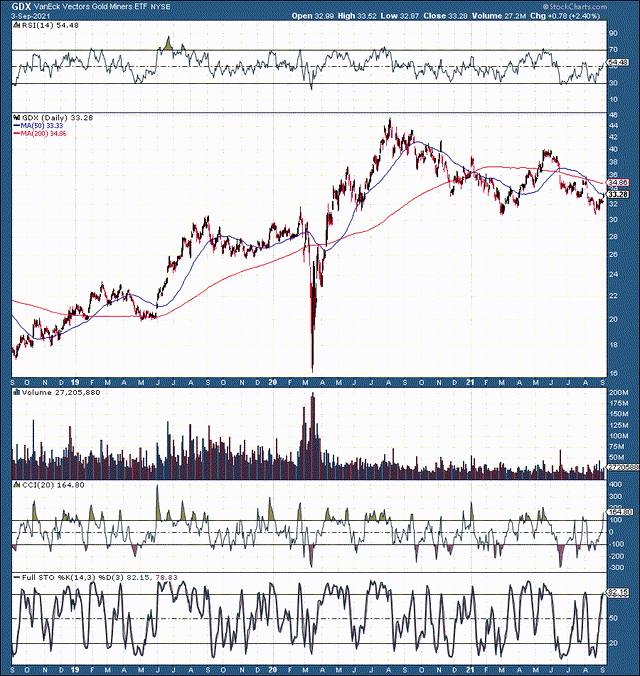
Source: stockcharts.com
GDX illustrates a similar pattern relative to gold. We see nearly an identical long-term double bottom formation around the crucial $30 level in GDX. It seems probable that GDX/gold miners can start climbing notably higher from here. Gold miners are a great way to play the gold rally, as they typically appreciate at a 2-3x ratio relative to gold.
The Bottom Line
Gold recently concluded a long-term correction process. The metal dropped by 20% and now appears like it is beginning a new long-term uptrend. In addition to the increasingly bullish technical setup, gold should benefit from a remarkably favorable fundamental backdrop. Fed policy, inflation, a perpetually increasing monetary base, and a slew of other constructive essential factors should enable sentiment surrounding gold to strengthen. As improved sentiment translates into increasing demand, gold should move substantially higher from here, and we could see gold reach around $5,000 within the next 1-2 years.
Disclaimer: This article expresses solely my opinions, is produced for informational purposes only, and is not a recommendation to buy or sell any securities. Investing comes with risk to loss ...
more

