
Gold Twice Yanked Twice Tanked
Nothing like living the prior week all over again, eh?
First it was the lousy StateSide September payrolls number as we nauseatingly documented a week ago. Thus as you already know, that report rightly yanked Gold up some +20 points in less than an hour... only to then see price tank from whence it came during the following hour.
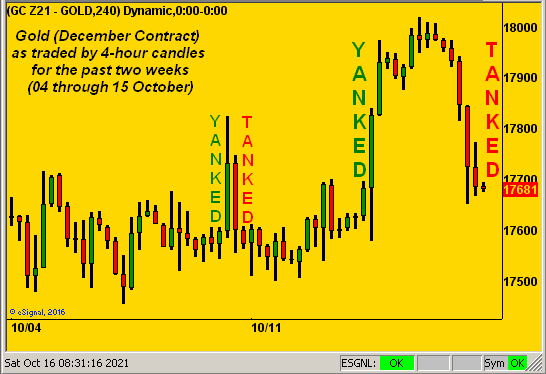
Second this past Wednesday into Thursday came the cavalcade of wholesale inflation worries, Dollar weakness, mixed musings of FOMC minutes, and Gold trading volume exaggeratively reported as "massive" (but not really), that all double-yanked Gold up some +40 points during said two-day stint ... only to then see it tank from whence it came during Friday. Two yanks, two tanks, and the dust settled yesterday with Gold at 1768, essentially where it all started two weeks ago.
Be it influenced by the M word or otherwise -- given the market is never wrong -- here is the trade of Gold across the past two weeks. And NO its does NOT look NORMAL:
To be sure, this Gold yank n' tank is (in our most eloquent use of the vernacular) a pain in the ass. And yet, there goes the abstract shiny object bits**t back over $60,000/crap, which the "Here Today Gone Tomorrow Dept." has yet to zap.
But hang on a sec: "Miss Gibbs? Any word on when those blockchain-bustin' quantum computers are going to be available? What's that? Not in the stores in time for the holidays? OK, thank you Miss Gibbs." (She's a winner). Well then, it looks like we'll still have to wait a while. "Hey Honey! I lost our bit key!" That'll be quite the day, eh? Add to that for the market and the economy FedGov Lael "The Brain" Brainard's inferred "Climate Change Crash", and on a wing and a prayer Gold "can" swiftly ascend to at least the present Scoreboard's valuation of $3,958/oz. ... and beyond! But "shall" it?
Let's be honest and hopefully not be holding our breath: 'tis indeed a most challenging time for the Gold analyst, price today where 'twas a decade ago, whilst the impetii -- notably the 3Ds of Debasement / Debt / Derivatives -- grow geometrically high favoring a Gold (GLD) run to the sky. So when the heck is it gonna get going?
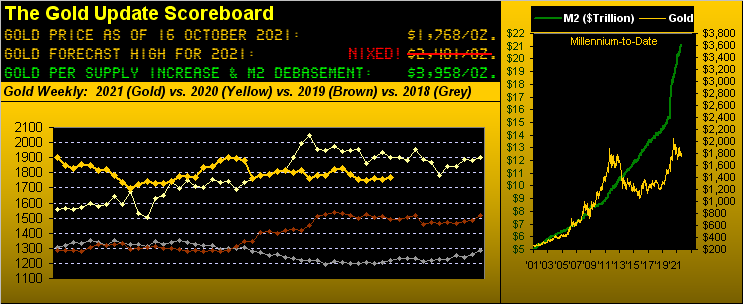
Reprise: the market is never wrong. But it can be terrifically mis-valued. Just as Gold today (1768) is priced at but 45% of its duly Dollar-debased value (3958), so too is the S&P 500 today (4471) priced at 254% of its 64-year median price/earnings ratio (20.4x or 1763). Which for you WestPalmBeachers down there means to achieve acceptable valuation, the broken-record saga continues: Gold need double and the S&P need be halved.
"But earnings are looking really great, mmb..."
As well they ought Squire: Q3 Earnings better well be comparatively "great" to those of a year ago when so much of the world was closed. And clearly the banks came through this past week with BIG earnings. Further, with 24 of the S&P 500's constituents having thus far reported, 83% have improved their bottom lines: "Party Time!", (i.e. "We don't need no stinkin' crash season..."). Perhaps not yet.
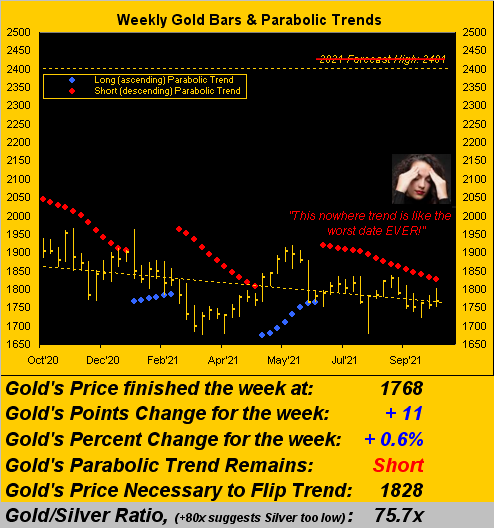
And then there's Gold (quit snoring in the back there), which just completed its 16th week of parabolic Short trend, a tie for sixth in duration since 2001. Remember: Gold's settle back on 02 July when this trend formally began was 1788 vs. today's 1768, the average weekly close therein being 1787. That is about as meek an unending Short Trend as we'll find. And to quote our wonderful futures mentor (one PFH) from three decades ago: "Well, if it can't go down, then it's gonna go up." No time like the present, what? Here are Gold's weekly bars and parabolic trends since this time a year ago:
Broadly, Gold has basically been pulling back since achieving its All-Time-High at 2089 on 07 August 2020. So in looking at this view of the daily closes across the past 11 years, the recent technical staleness obviously doesn't reveal the fundamental firmness for which we're all twiddling our thumbs to make a dramatic price appearance:

Meanwhile, the International Monetary Fund is pulling back on its assessment of global economic growth, with a worried eye to inflation in the balance. All of that is long-hand for short-hand "stagflation". "Got Gold?"
Still StateSide, the economy continues to bubble along whilst folks merrily wallow in their marked-to-market wealth:

In fact, 'tis all so good that Federal Reserve Vice Chair Richard "Clearly" Clarida looks to the Fed's asset purchases being curtailed 'round the middle of next year. Clear?
Clear as mud is Gold's recent price track: "Yank 'n Tank! Yank 'n Tank!" as we below see on the left in the panel of price's daily bars from three months ago-to-date. Note that at least the baby blue dots of linear regression trend consistency have broken above their 0% axis indicative of such trend rotating to positive. Then on the right we've the like panel for Silver (SLV). The takeaway there is her patterns being sufficiently similar to those for Gold such that Silver is adorned in her precious metal pinstripes rather than in her industrial metal jacket. (Albeit as such, Silver is not benefitting from Copper's meteoric rise of late, +17.9% in just the past 12 trading days):

Now to the 10-day Market Profiles for Gold (below left) and Silver (below right). Note therein that Sister Silver is at present better positioned than is Gold. Hence the recent reduction in the Gold/Silver ratio from 80.2x on 29 September down to 75.7x today; (well, maybe Cousin Copper (JJC) helped a wee bit):

And specific to Gold, here's how it currently stacks up
The Gold Stack
Gold's Value per Dollar Debasement, (from our opening "Scoreboard"): 3958
Gold’s All-Time Intra-Day High: 2089 (07 August 2020)
Gold’s All-Time Closing High: 2075 (06 August 2020)
2021's High: 1963 (06 January)
The Gateway to 2000: 1900+
The 300-Day Moving Average: 1833 and falling
The Weekly Parabolic Price to flip Long: 1828
10-Session directional range: up to 1802 (from 1745) = +57 points or +3.3%
The Final Frontier: 1800-1900
The Northern Front: 1800-1750
Trading Resistance: 1774 / 1793 / 1800
10-Session “volume-weighted” average price magnet: 1768
Gold Currently: 1768, (expected daily trading range ["EDTR"]: 24 points)
Trading Support: 1758
On Maneuvers: 1750-1579
2021's Low: 1673 (08 March)
The Floor: 1579-1466
Le Sous-sol: Sub-1466
The Support Shelf: 1454-1434
Base Camp: 1377
The 1360s Double-Top: 1369 in Apr '18 preceded by 1362 in Sep '17
Neverland: The Whiny 1290s
The Box: 1280-1240
We'll 'round it out here with these three notes:
■ The StateSide Social Security Administration says they're gonna bump up their monthly payments next year by +5.9%. 'Course that almost certainly necessitates an ongoing raising of the debt ceiling via what now seem to be quarterly Congressional pie-fights. (See the dominoes in the aforeshown Econ Baro).
■ Did you catch this past week's warning from the International Energy Agency that spending on "clean energy" must triple to curb the carrying-on of climate change? Puts us in mind of the '65 film "Our Man Flint" wherein the bad guys are "demonstrating that they can control the weather!" --[Lee J. Cobb]. Bodacious Stuff, one has to say.
■ Indeed speaking of BS, doubtless you didn't miss one James "Dazzling" Dimon's reiteration of aforementioned bits**t as being worthless, joined in sympathy thereto this past Wednesday by one Laurence "The" Fink. Both bright boys.
So at the end of the day, don't find yourself financially finked nor dazzled into following shiny objects; for despite this present prank of Gold's yank 'n tank, its best days ahead you surely shall thank!

Cheers!
...m...
Disclaimer: If ever a contributor needed a disclaimer, it's me. Indeed, your very presence here has already bound you in the Past, Present and Future to this disclaimer and to your acknowledging ...
more

