
Gold Surely Soaring; Stock Market Warning
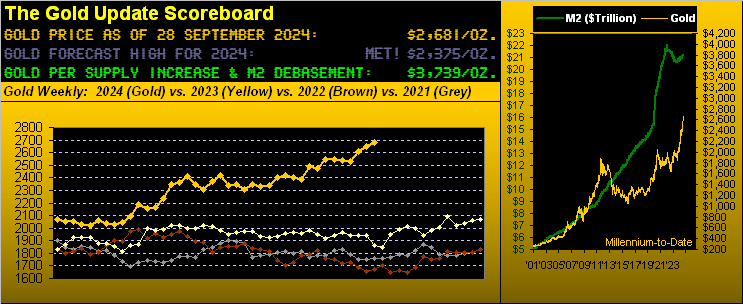
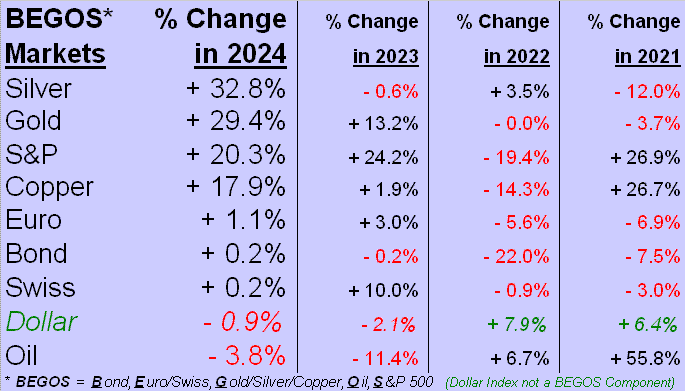
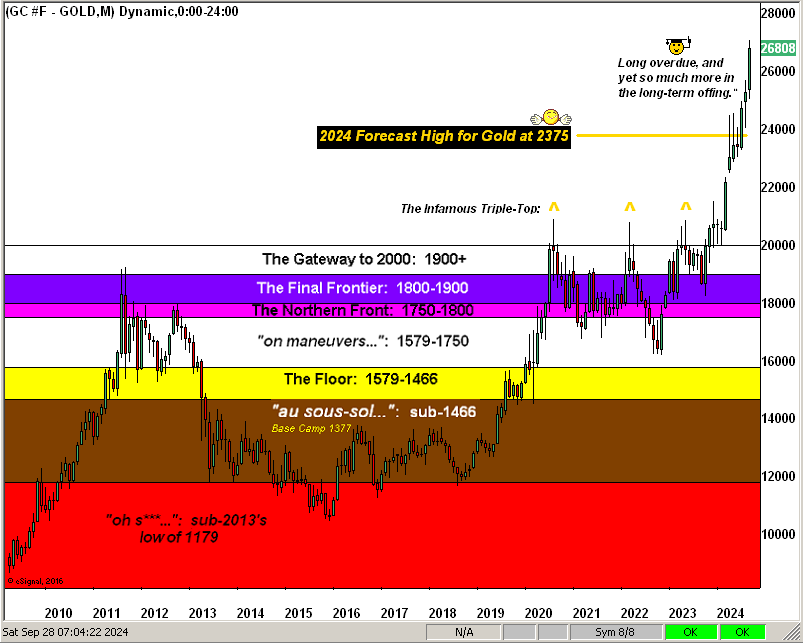
Soaring indeed has been our Gold:year-to-date, price has risen from last year’s settle at 2072 to as high as 2709 this past Thursday, to then settle the week yesterday (Friday) at 2681.That is a net year-to-date gain of +29.4% to keep Gold on the podium per our BEGOS Markets Standings thus far for 2024:
Moreover, how lovely ’tis to see sweet Sister Silver topping the entire troupe.We’ve herein pounded the table seemingly forever on Silver’s relative undervaluation to Gold, both precious metals of which — despite record Gold highs — still remain cheap by currency debasement:
- Gold today at 2681 is nonetheless -28% below its Dollar debasement value (per the opening Gold Scoreboard) of 3739;
- Silver today at 31.92 is attractively -18% below its pricing by the average century-to-date Gold/Silver ratio of 68.5x, the ratio itself today 84.0x:but priced to that average ratio puts Silver instead at 39.16;
- ‘Course, this then is the cherry on top:price Gold today at its 3739 debasement value with Silver priced per the average Gold/Silver ratio of 68.5x and you’ve got Silver at 54.58 … just in case you’re scoring at home.
From Silver’s scoring to Gold’s soaring:the yellow metal’s year-to-date +29.4% gain through the 187 trading days thus far in 2024 ranks far and away its best percentage increase specific to such stint across this century’s 24 years.A distant second-best is 2016’s +24.9% gain through that year’s first 187 trading days; (the worst such year-to-date stint was -20.2% in 2013 as the wheels continued to come off following Gold’shaving “gotten ahead of itself” as we’d herein presciently penned back in 2011).
More toward “The Now”:as well as Gold is soaring — yet still remaining cheap by Dollar debasement — price persists as “high” relative to near-term valuation vis-à-vis its smooth line borne of movements to those of the five primary BEGOS Markets (Bond / Euro / Gold / Oil / S&P 500).Here from the website is our Market Value chart of Gold from one year ago-to-date astride that smooth valuation line; the oscillator in the lower panel (price less valuation) shows Gold presently priced as +148 points “high”, with “means reversion” inevitably in the balance as you can see across the graphic:
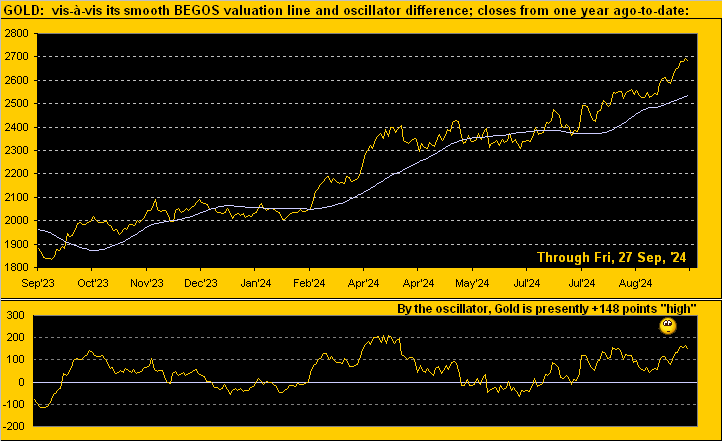
Near-term “overvaluation” notwithstanding, Gold simply looks great by its weekly bars from one year ago-to-date. Even were price to suddenly snap back down those 148 points as just shown (to 2533), ‘would still be above the rightmost parabolic blue dot which per the weekly graphic is at 2478.Again, great:
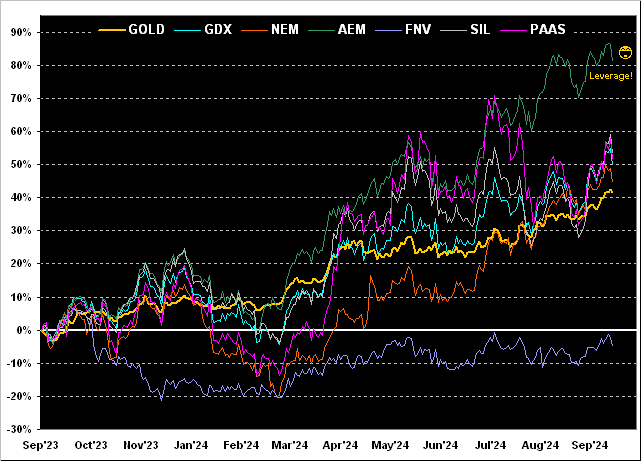
Staying with our year-over-year theme, here next is the percentage track of Gold along with those of its key equities brethren. How’s the AEM leverage working out for ya? That track of Agnico Eagle Mines is +81%, followed by the Global X Silver Miners exchange-traded fund (SIL) +53%, Pan American Silver (PAAS) +52%, the VanEck Vectors Gold Miners exchange-traded fund (GDX) +50%, Newmont (NEM) +45%, Gold itself +42%, and Franco-Nevada sorting through its Panamanian exasperation (FNV) -5%. Still, that’s diversification, right there!
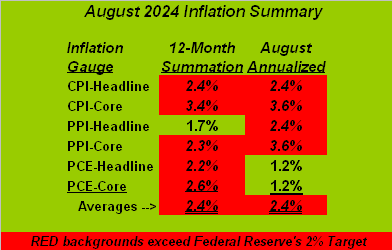
Meanwhile, on the heels of the Federal Reserve’s “Jumbo” -50bp FundsRate cut of a week ago, we’ve since received all the salient data to complete our inflation summary for August.Remember: those figures sporting the red backgrounds are running ahead of the Fed’s +2.0% inflation target.So was “Jumbo” in hindsight rather “dumbo”?FedGov Michelle “In the know” Bowman seems to think so, her dissenting Open Market Committee vote for “Jumbo” being “No”, preferring instead for -25bps to go.Might the FOMC later say “Oh no…”?
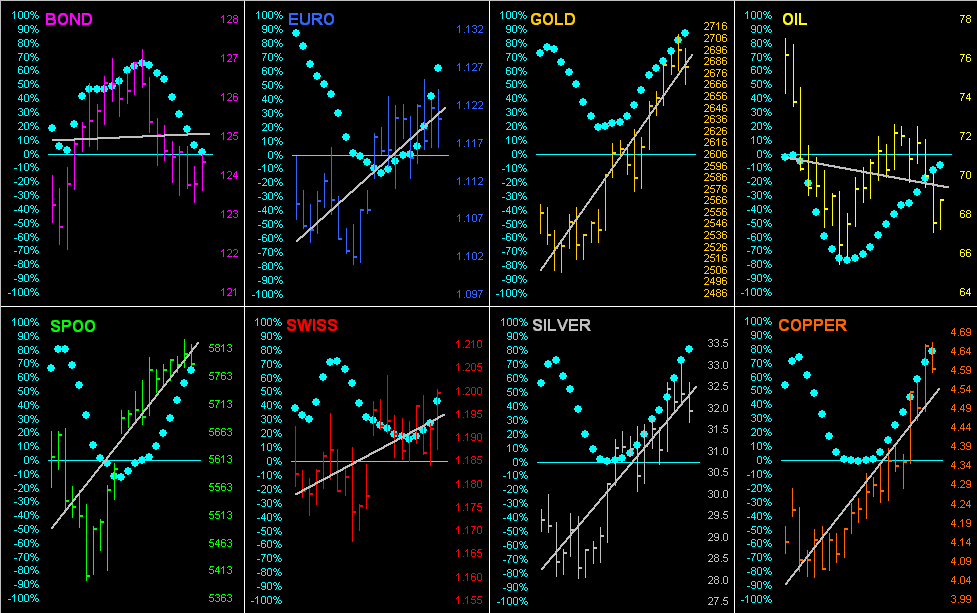
What we do know is that the Fed’s -50bp FundsRate cut has been beneficial on balance for the BEGOS Markets, six of the eights components therein having since moved higher, (save for the Bond and Oil).Let’s go ’round the horn for the whole bunch across their last 21 trading days (one month), replete with their respective grey trendlines and “Baby Blues”, the dots that depict the day-to-day consistency of each trend.Therein, note the tight correlation of the Metals Triumvirate as the panels for Gold, Silver and Copper appear practically identical:
(Click on image to enlarge)
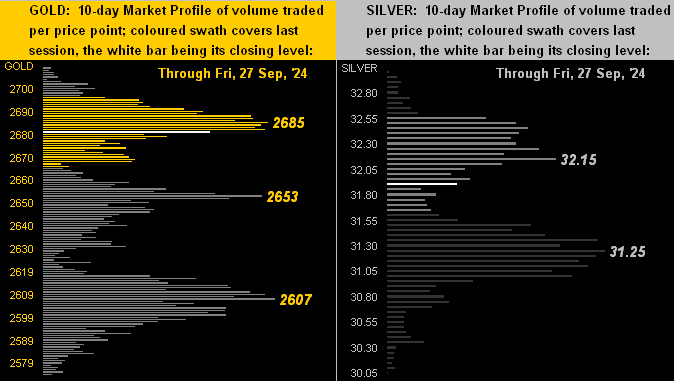
Particularly for the precious metals, next we’ve their 10-day Market Profiles featuring Gold on the left and Silver on the right.Denoted are those respective prices having traded the most amount of volume during the past two weeks; such prices we regularly consider as support and resistance levels:
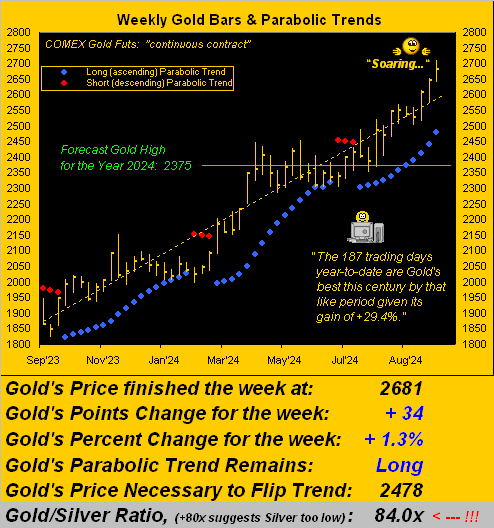
With but one trading day remaining in the month, indeed in Q3, ’tis time to bring up (literally) Gold’s structure by its monthly bars across the past 16 years, the stratified “memories” as labeled.Whilst we all understand that “nothing moves in a straight line” — and that Gold as aforeshown is significantly “high” relative to its near-term BEGOS valuation — The Big 3000 is sitting on the table, a price certainly to be achieved given that the yellow metal historically always catches up to prior high levels of debasement value (again which at present is 3739):’tis merely about “The When”.And from today at 2681, a “mere” +11.9% puts Gold at The Big 3000:
(Click on image to enlarge)
“All fine info, mmb, but your title mentions ‘Stock Market Warning’, so…“
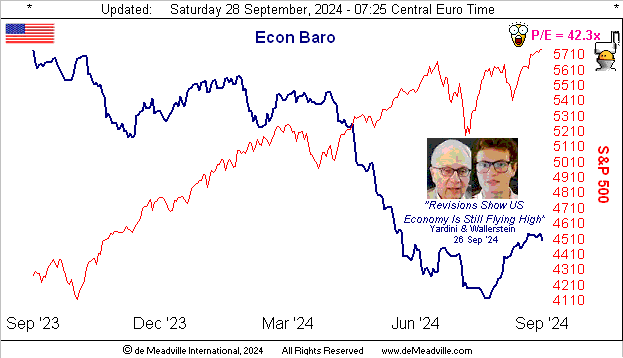
Yessir, Squire, we’ve saved the juiciest (or better stated “scariest”) bit for last.Let’s first go to the Economic Barometer, itself actually having notably improved over the past five weeks.Indeed from 22 August-to-date, 63 metrics have come into the Econ Baro, 38 (60%) of which have improved period-over-period.Thus the Baro has been boosted by better numbers combined with those “getting worse more slowly” –[P. Krugman, 02 May ’01].Here ’tis, “flying high” (by some eyes), whilst the S&P 500’s red line blows through the skies:
But to our Stock Market Warning:as Squire duly reminds us, so is stated in this missive’s title.(Indeed for further analysis you may also refer back to the 712th edition of The Gold Update from 08 July 2023 entitled “Gold’s Downtrend Duly Dissed?Stocks’ 10 Crash Catalysts!”).
To continue, hardly have we been silent on the year-in, year-out overvaluation of the stock market as measured by the S&P 500.Simply stated by any historical gauge, earnings (or lack thereof) remain unsupportive of price, period!
- We just queried “AI” (“Assembled Inaccuracy”) for the current price/earnings ratio of the S&P.The “reply” was “29.2x” without respect to past or forward earnings.‘Course because as you ad nauseum know we do the honest math, the “live” cap-weighted P/E is actually 42.3x using trailing twelve-month earnings, (earnings-less companies being assigned the price of their shares as the P/E).And since introducing such “live” P/E in 2013, it has increased +67%. Whoops.
- Again we quote J. B. Cohen: “…in bull markets the average [P/E] level would be about 15 to 18 times earnings.” To get down to such rational valuation, earnings at today’s S&P level need double if not triple.Does the above Econ Baro suggest such robust growth?Nope.Or shall the policies of the next StateSide President?Of course not. Whoops.
- The S&P 500’s market capitalization today is $50.3T for which the readily available money supply (M2) to cover is “only” $21.2T. Whoops.
- Had COVID never occurred (and thus neither the $7T of monetary infusion), the S&P today would be ’round 3000 (vs. today’s 5738) and everybody’d be happy as clams. Whoops.
- Geo-political disruptions (understatement). Whoops.
“That’s lots of catalysts, mmb, but what do you think really sets it off?“
The oldest catalyst throughout market history, Squire: flat out fear, influenced to an extent by the modern-day FinMedia which at times refers to a -5% correction as a “crash”; now just add a zero, (which for you WestPalmBeachers down there makes -50%). And today given there’re so many invested “first timers” (i.e. the happy, no-crash experience, marked-to-market millionaires), next time the fear shall be ferocious and future plans-altering. “Nobody Knows You When You Are Down and Out” – [Jimmie Cox, 1923]. Whoops.
And most importantly, overvaluation (to use a “woke” term) “awareness” is finally spreading. A valued friend (formerly at the very apex of a major investment bank) in a just-issued interim report to investors warned of a stock market correction reaching -50%. Respected Gold analyst Jim Rickards recently said same. Whilst we’re in the camp for a “milder” -35% skid, our excellent co-director here is in the -40% camp. Indeed “The When”? Before year-end? Whoops.
Then (hat-tip The Times of India) for further “awareness”:
Or more accurately, aBEARness? Got Gold??
More By This Author:
Gold Flies as Dumbo* Whilst the Fed Goes JumboGold’s 2nd-Narrowest Week As GDP Defies Belief
Gold Gradually Grips As The Dollar Decidedly Dips
Disclaimer: If ever a contributor needed a disclaimer, it's me. Indeed, your very presence here has already bound you in the Past, Present and Future to this disclaimer and to your acknowledging ...
more

