
Gold Prices Surge To New Highs Despite Overbought

Image Source: Pixabay
Gold prices have surged to new highs, drawing attention from traders and investors. The market now faces a crucial technical level, indicating an overbought condition similar to past peaks. Economic and geopolitical factors also contribute to price movements. Understanding these dynamics is key to predicting the next trend in gold prices.
Gold's Overbought Levels and Historical Comparison
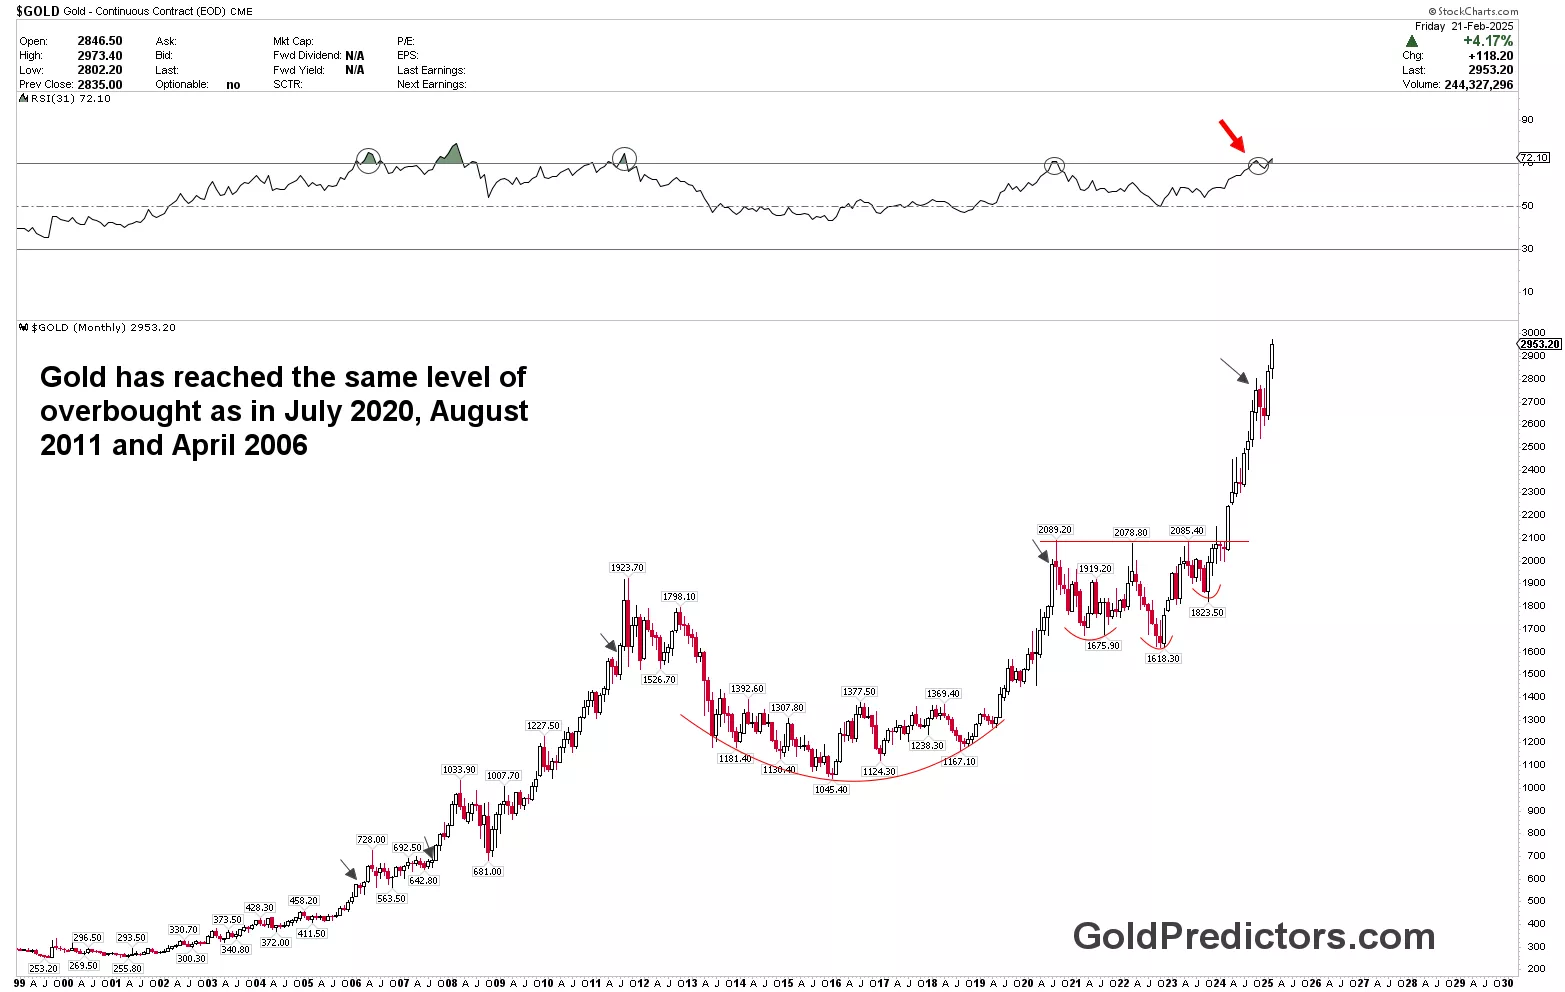
Gold has reached an overbought level, as indicated by the Relative Strength Index (RSI) on the provided chart. The RSI value is above 70, signaling strong bullish momentum but also a possible correction ahead. The chart highlights previous instances of similar RSI levels in July 2020, August 2011, and April 2006. In each of these cases, gold saw a pullback or consolidation phase after reaching an extreme RSI reading.
Past trends suggest that gold’s price often corrects after reaching such overbought conditions. In August 2011, gold hit a record high before entering a prolonged decline. Similarly, in July 2020, a pullback followed after an initial surge. These historical comparisons indicate that traders should be cautious about expecting uninterrupted gains.
Technical Analysis of Gold’s Price Action
The monthly chart below shows a strong upward trend, with gold reaching new all-time highs. Buyers have fueled this rally by pushing prices above key resistance levels, creating a parabolic move that often leads to volatility. Gold has decisively broken past the $2,075 resistance level, confirming a bullish breakout. The price action displays a pattern of higher highs and higher lows, reinforcing the ongoing uptrend. However, the RSI has entered the overbought territory, which historically signals potential corrections or consolidation. Meanwhile, high trading volume reflects strong buying interest, though signs of exhaustion could appear soon.
(Click on image to enlarge)
Traders and investors are closely watching how gold reacts at these levels. If buyers sustain a move above $2,950, the rally could extend further. However, if sellers gain control, the price may retrace toward $2,800 or lower, leading to short-term pullbacks.
Conclusion
Gold’s price (XAU/USD) is holding on to intraday gains, supported by strong buying interest and favorable market conditions. A pullback in US yields has further boosted demand, reinforcing gold’s upward momentum. Traders are closely watching key economic indicators, as any shifts in market sentiment could influence the metal’s next move. To receive gold and silver trading signals, please subscribe here.
More By This Author:
Gold Price Surges As Geopolitical Tensions And US Tariffs Increase
Gold Prices Hold Gains Amid Trade War Concerns And Fed's Hawkish Stance
Gold Price Analysis: Bullish Breakout Signals Path To $3,000 Amid Economic Uncertainty
Disclosure: Materials distributed by GoldPredictors.com has no regard to the specific investment objectives, financial situation or the particular needs of any visitor or subscriber. This site ...
more

