

Image Source: Pixabay
Gold price (XAU/USD) maintains modest intraday gains on Thursday. However, the price struggles to extend its momentum and remains below the record high seen earlier this week. Investors remain cautious about the impact of US President Donald Trump's trade tariffs, which could lead to a global trade war. This concern continues to support the safe-haven appeal of gold. Additionally, a decline in US Treasury bond yields is weighing on the US Dollar (USD), providing further support to the yellow metal.
Gold Price Movements and Market Influences
The gold market has been volatile due to geopolitical and economic concerns. Investors are closely monitoring the Federal Reserve’s stance on interest rates. Recent US inflation data supports expectations that the Fed will maintain higher interest rates for longer. The latest US Consumer Price Index (CPI) print showed stronger inflation figures, reinforcing the Fed’s hawkish stance.
Key factors influencing gold prices include Trump’s decision to impose tariffs on steel and aluminum imports, raising concerns about a global trade war, and a stronger US CPI report, with inflation rising 0.5% in January, its highest since August 2023. Additionally, Core CPI, which excludes food and energy prices, increased 3.3% year-over-year, surpassing market expectations. Fed Chair Jerome Powell reiterated that inflation remains a concern, suggesting that interest rate cuts are unlikely in the near term, while the Atlanta Fed President highlighted a strong labor market and resilient GDP, leading investors to scale back expectations for rate cuts. Meanwhile, a drop in US Treasury bond yields and a weaker USD have provided some support to gold prices. These factors have created mixed sentiment among traders, as safe-haven demand for gold remains strong, but the possibility of prolonged high interest rates limits further upside potential.
Technical Analysis of Gold Price
The technical chart of XAU/USD highlights key market trends. The gold price has been trading within an ascending broadening wedge, a pattern often associated with increasing volatility. This structure indicates that price swings are expanding, signaling potential breakout opportunities.
(Click on image to enlarge)
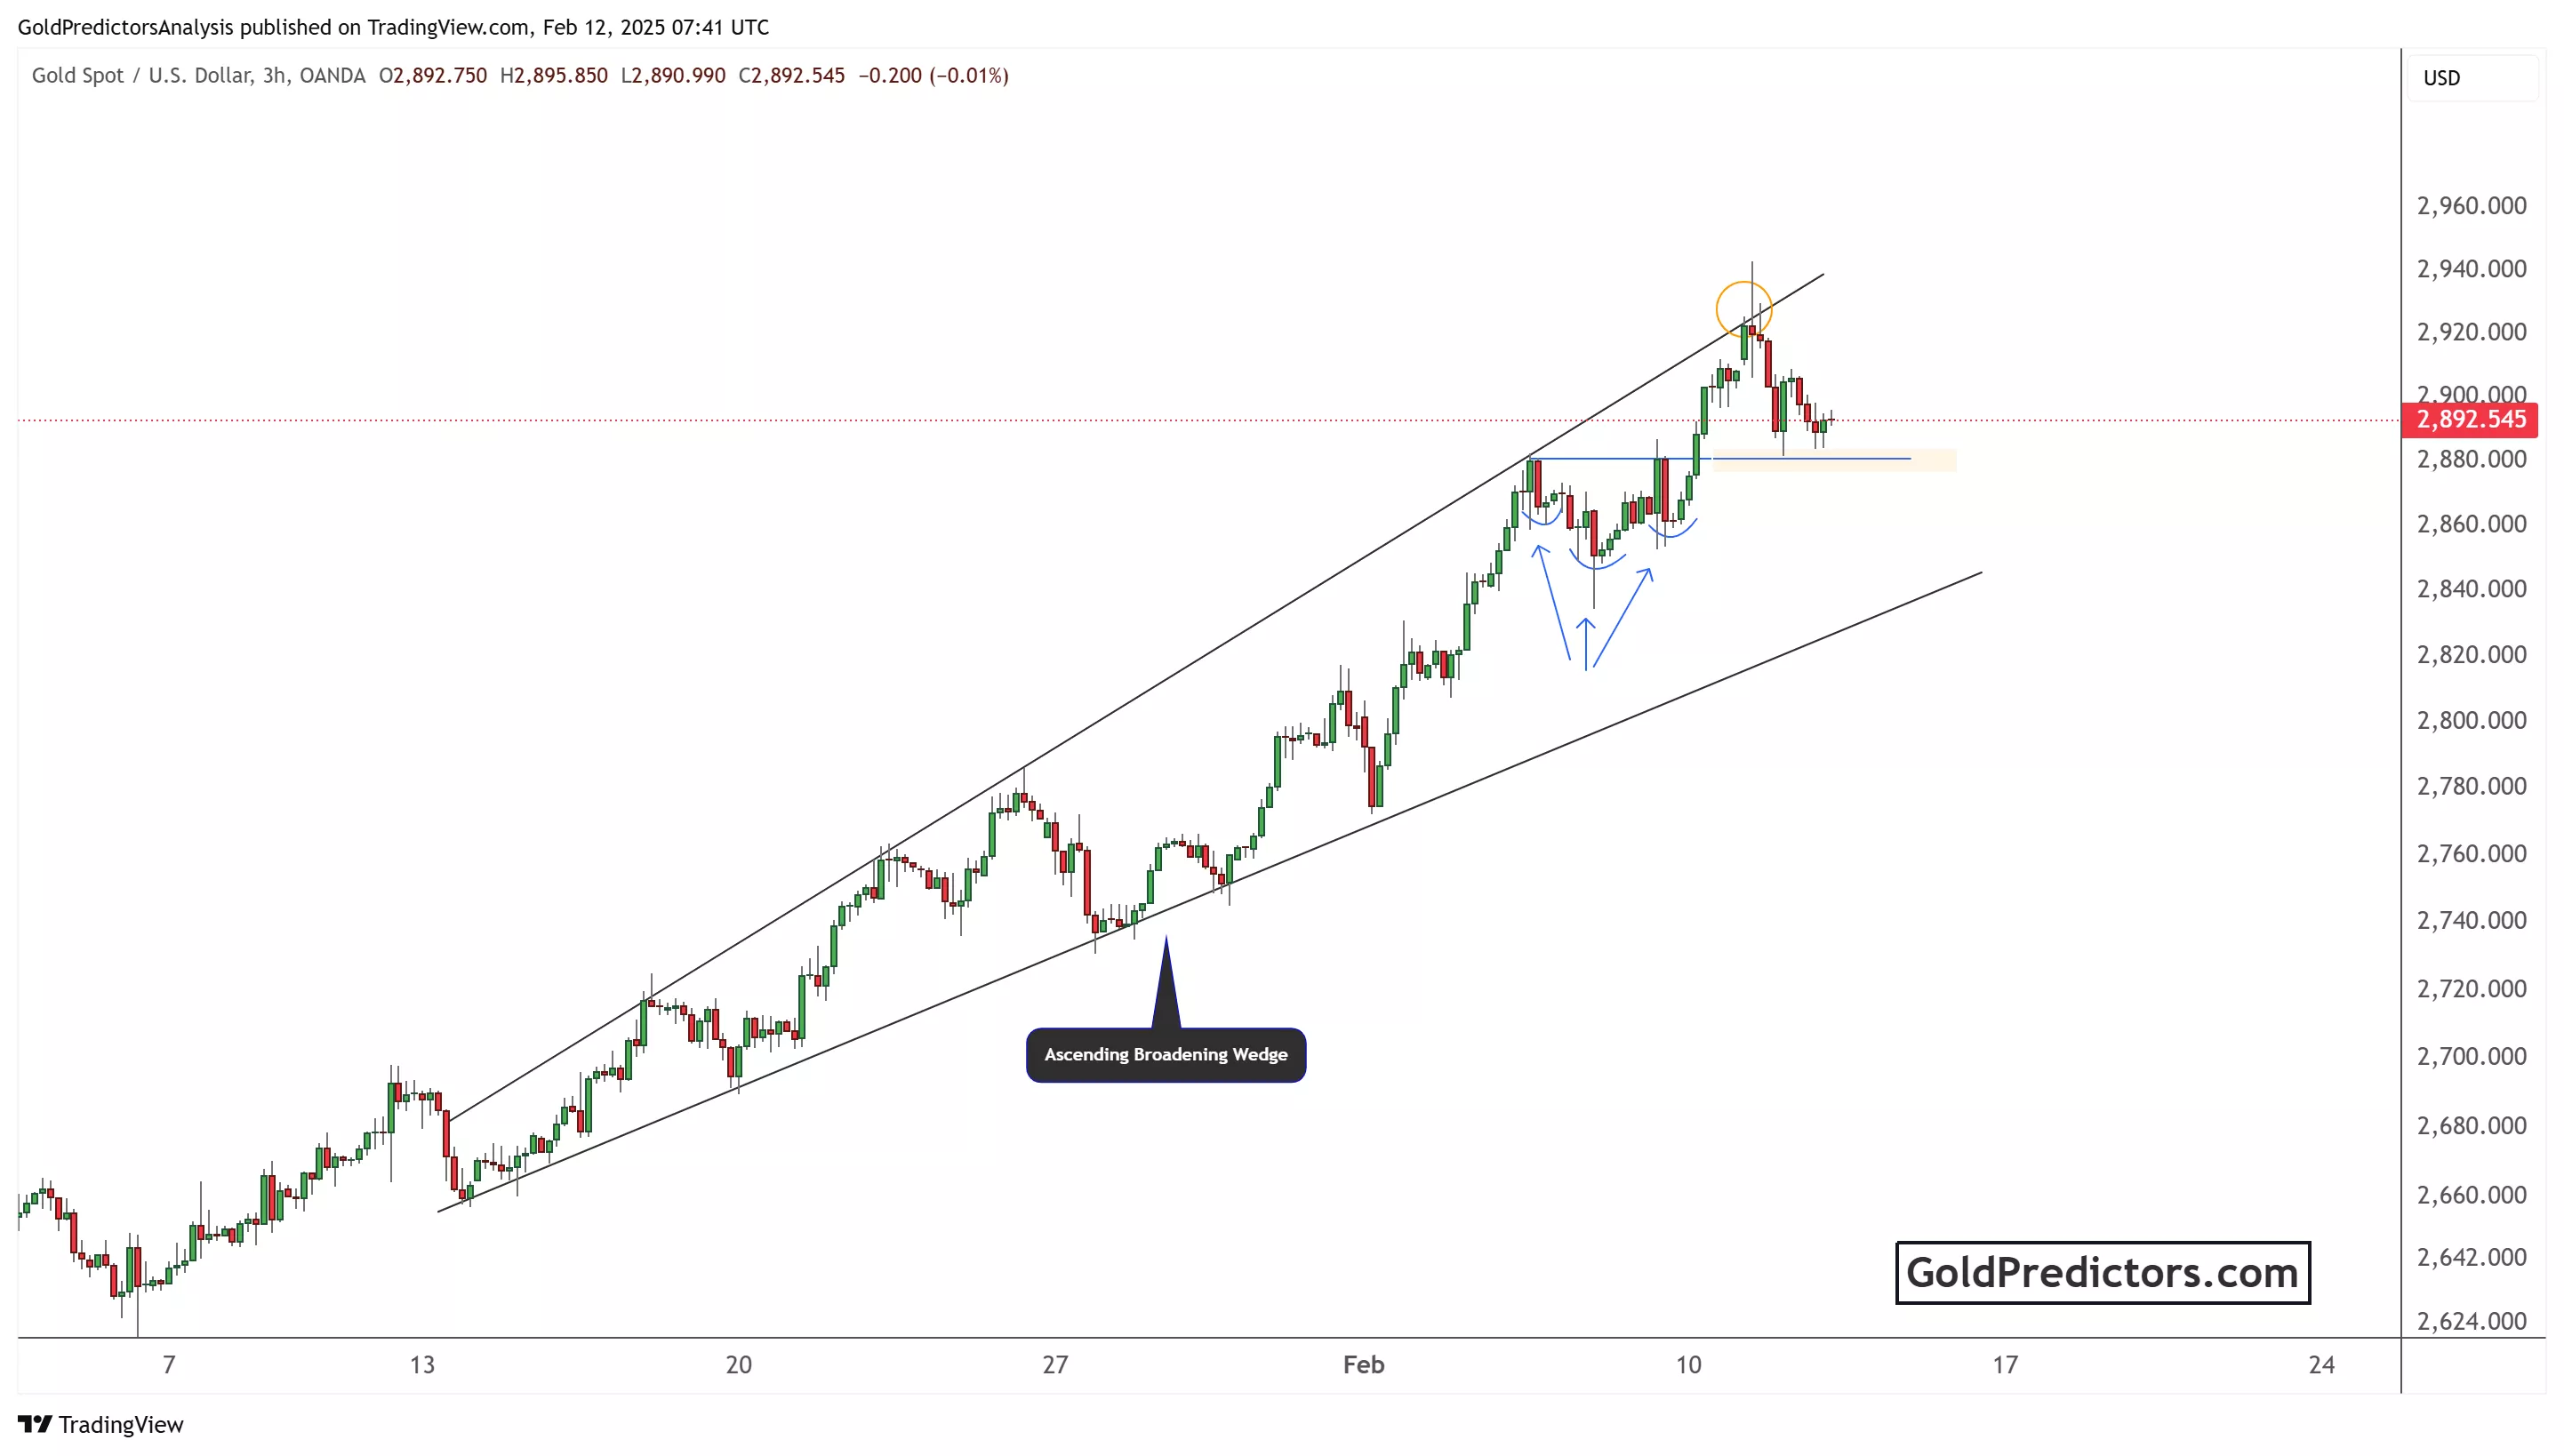
Key observations from the chart include a clear uptrend within the wedge, reflecting strong bullish momentum. Additionally, a double-bottom formation, marked by blue arrows, indicates a support zone where buyers stepped in to push prices higher. There was also a breakout attempt at the upper boundary, followed by a rejection, suggesting resistance near the $2,920-$2,940 range. Additionally, a pullback to a key support level could serve as a retest before another bullish move. If the price holds above the highlighted support zone, buyers might attempt another rally toward the recent high. However, a breakdown below this support could lead to further declines toward lower trendline levels.
Conclusion
Gold prices remain supported by geopolitical uncertainty, trade war concerns, and inflation fears. However, the Federal Reserve’s hawkish stance on interest rates caps further gains. Technically, gold is in an uptrend, but resistance near recent highs has led to a pullback. Traders are watching key support levels for potential buying opportunities. Market participants now focus on upcoming US economic data, including the Producer Price Index (PPI), which could provide further direction for gold prices.
More By This Author:
Gold Price Analysis: Bullish Breakout Signals Path To $3,000 Amid Economic Uncertainty
Gold Prices Present Volatility Amid Trump's Inauguration
Gold Price Analysis: Technical Breakouts And Long-Term Trends


Comments
Log in or sign up to join the conversation.