Gold Price Analysis: Technical Breakouts And Long-Term Trends

Image Source: DepositPhotos
Gold has long been regarded as a safe-haven asset, attracting investors during economic uncertainty. In recent years, gold's price action has demonstrated resilience, driven by macroeconomic factors and technical patterns. Moreover, the technical analysis for gold shows gold's consolidation phases, breakouts, and a broader trajectory, offering insights into its future potential.
Technical Analysis: Breakouts and Patterns
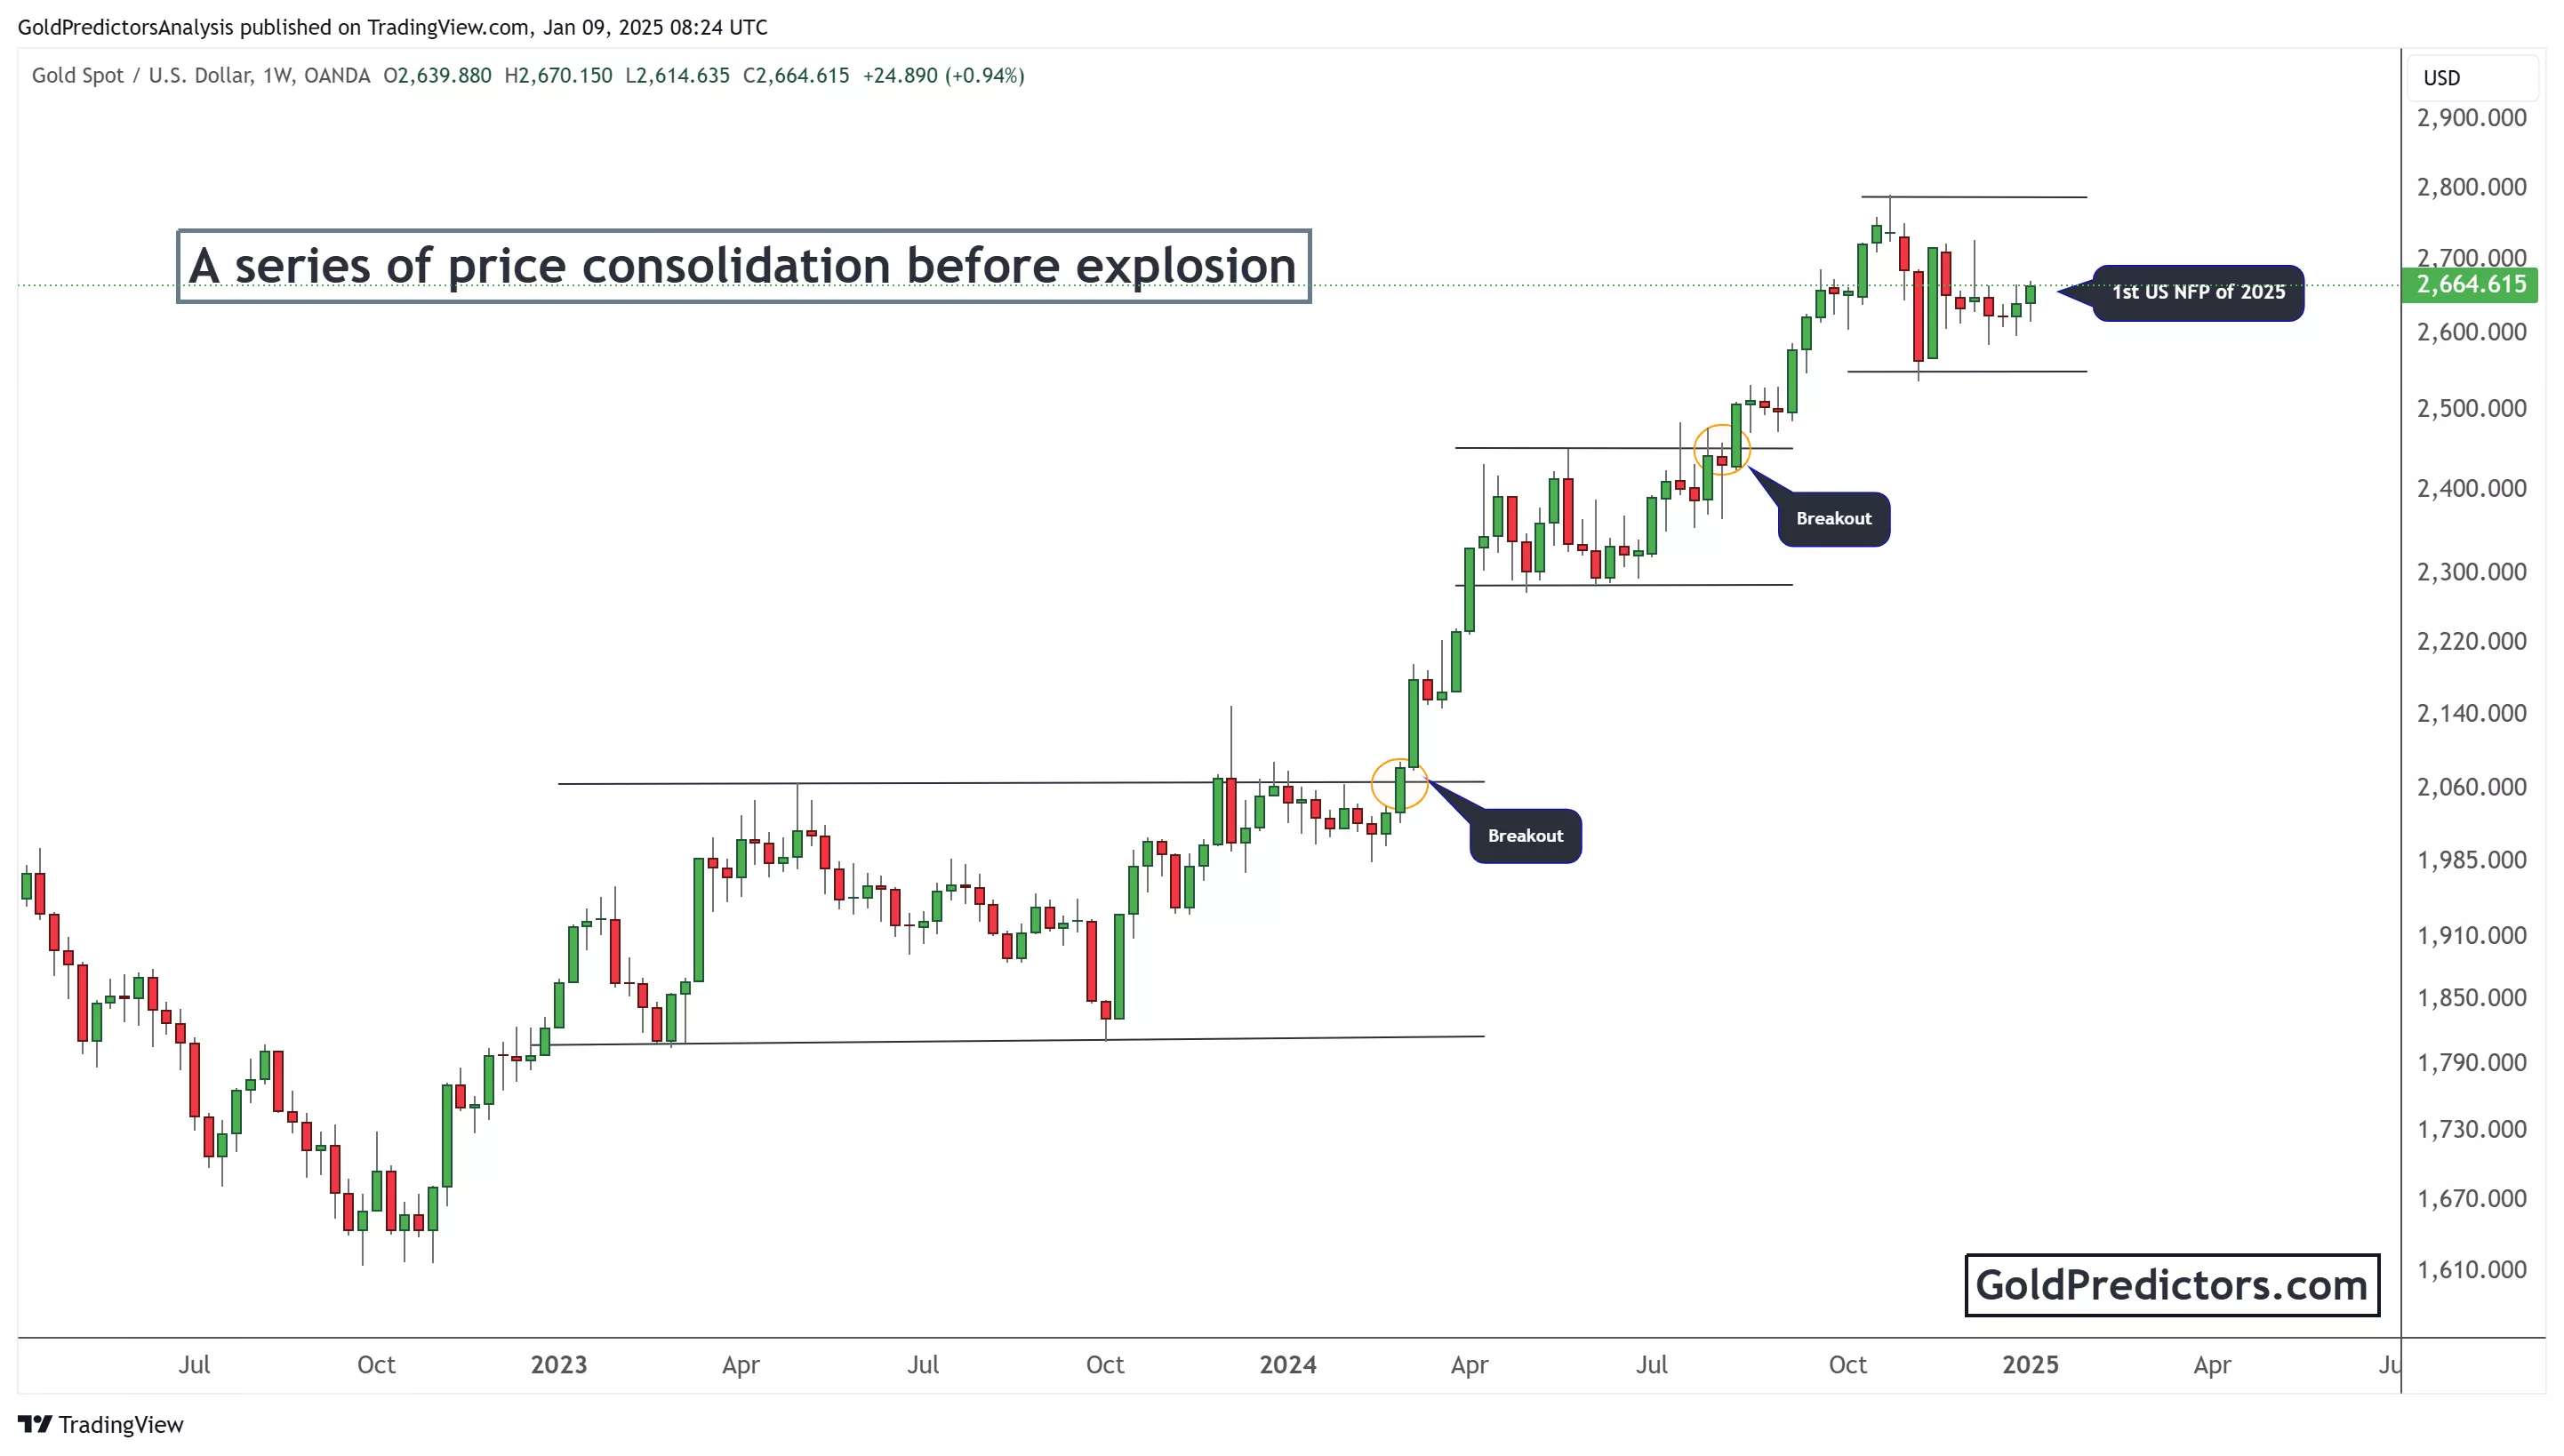
The chart below focuses on the weekly price movements of gold, highlighting a series of consolidation zones followed by explosive breakouts. These consolidations act as pauses in gold's upward trend, allowing the price to gather momentum before moving higher. Additionally, this pattern is a hallmark of strong bullish markets, where decisive moves to the upside follow stabilization periods.
(Click on image to enlarge)

Key takeaways from the chart include:
- Consolidation and Breakouts:
- The chart depicts multiple consolidation ranges where gold traded sideways within defined boundaries.
- Breakouts above these ranges marked the initiation of strong bullish trends.
- Notable breakouts occurred in early 2024 and late 2024, propelling gold to new highs.
- Role of Key Events:
- Economic events like the first US Non-Farm Payroll (NFP) of 2025 coincide with pivotal price movements. These events often serve as catalysts for breakouts, reflecting shifts in market sentiment.
- Investors closely monitor such data to assess economic health and potential monetary policy changes directly impacting gold prices.
- Higher Highs and Lows:
- The chart demonstrates a clear uptrend characterized by higher highs and higher lows.
- This structure reinforces the bullish narrative, suggesting strong underlying demand for gold.
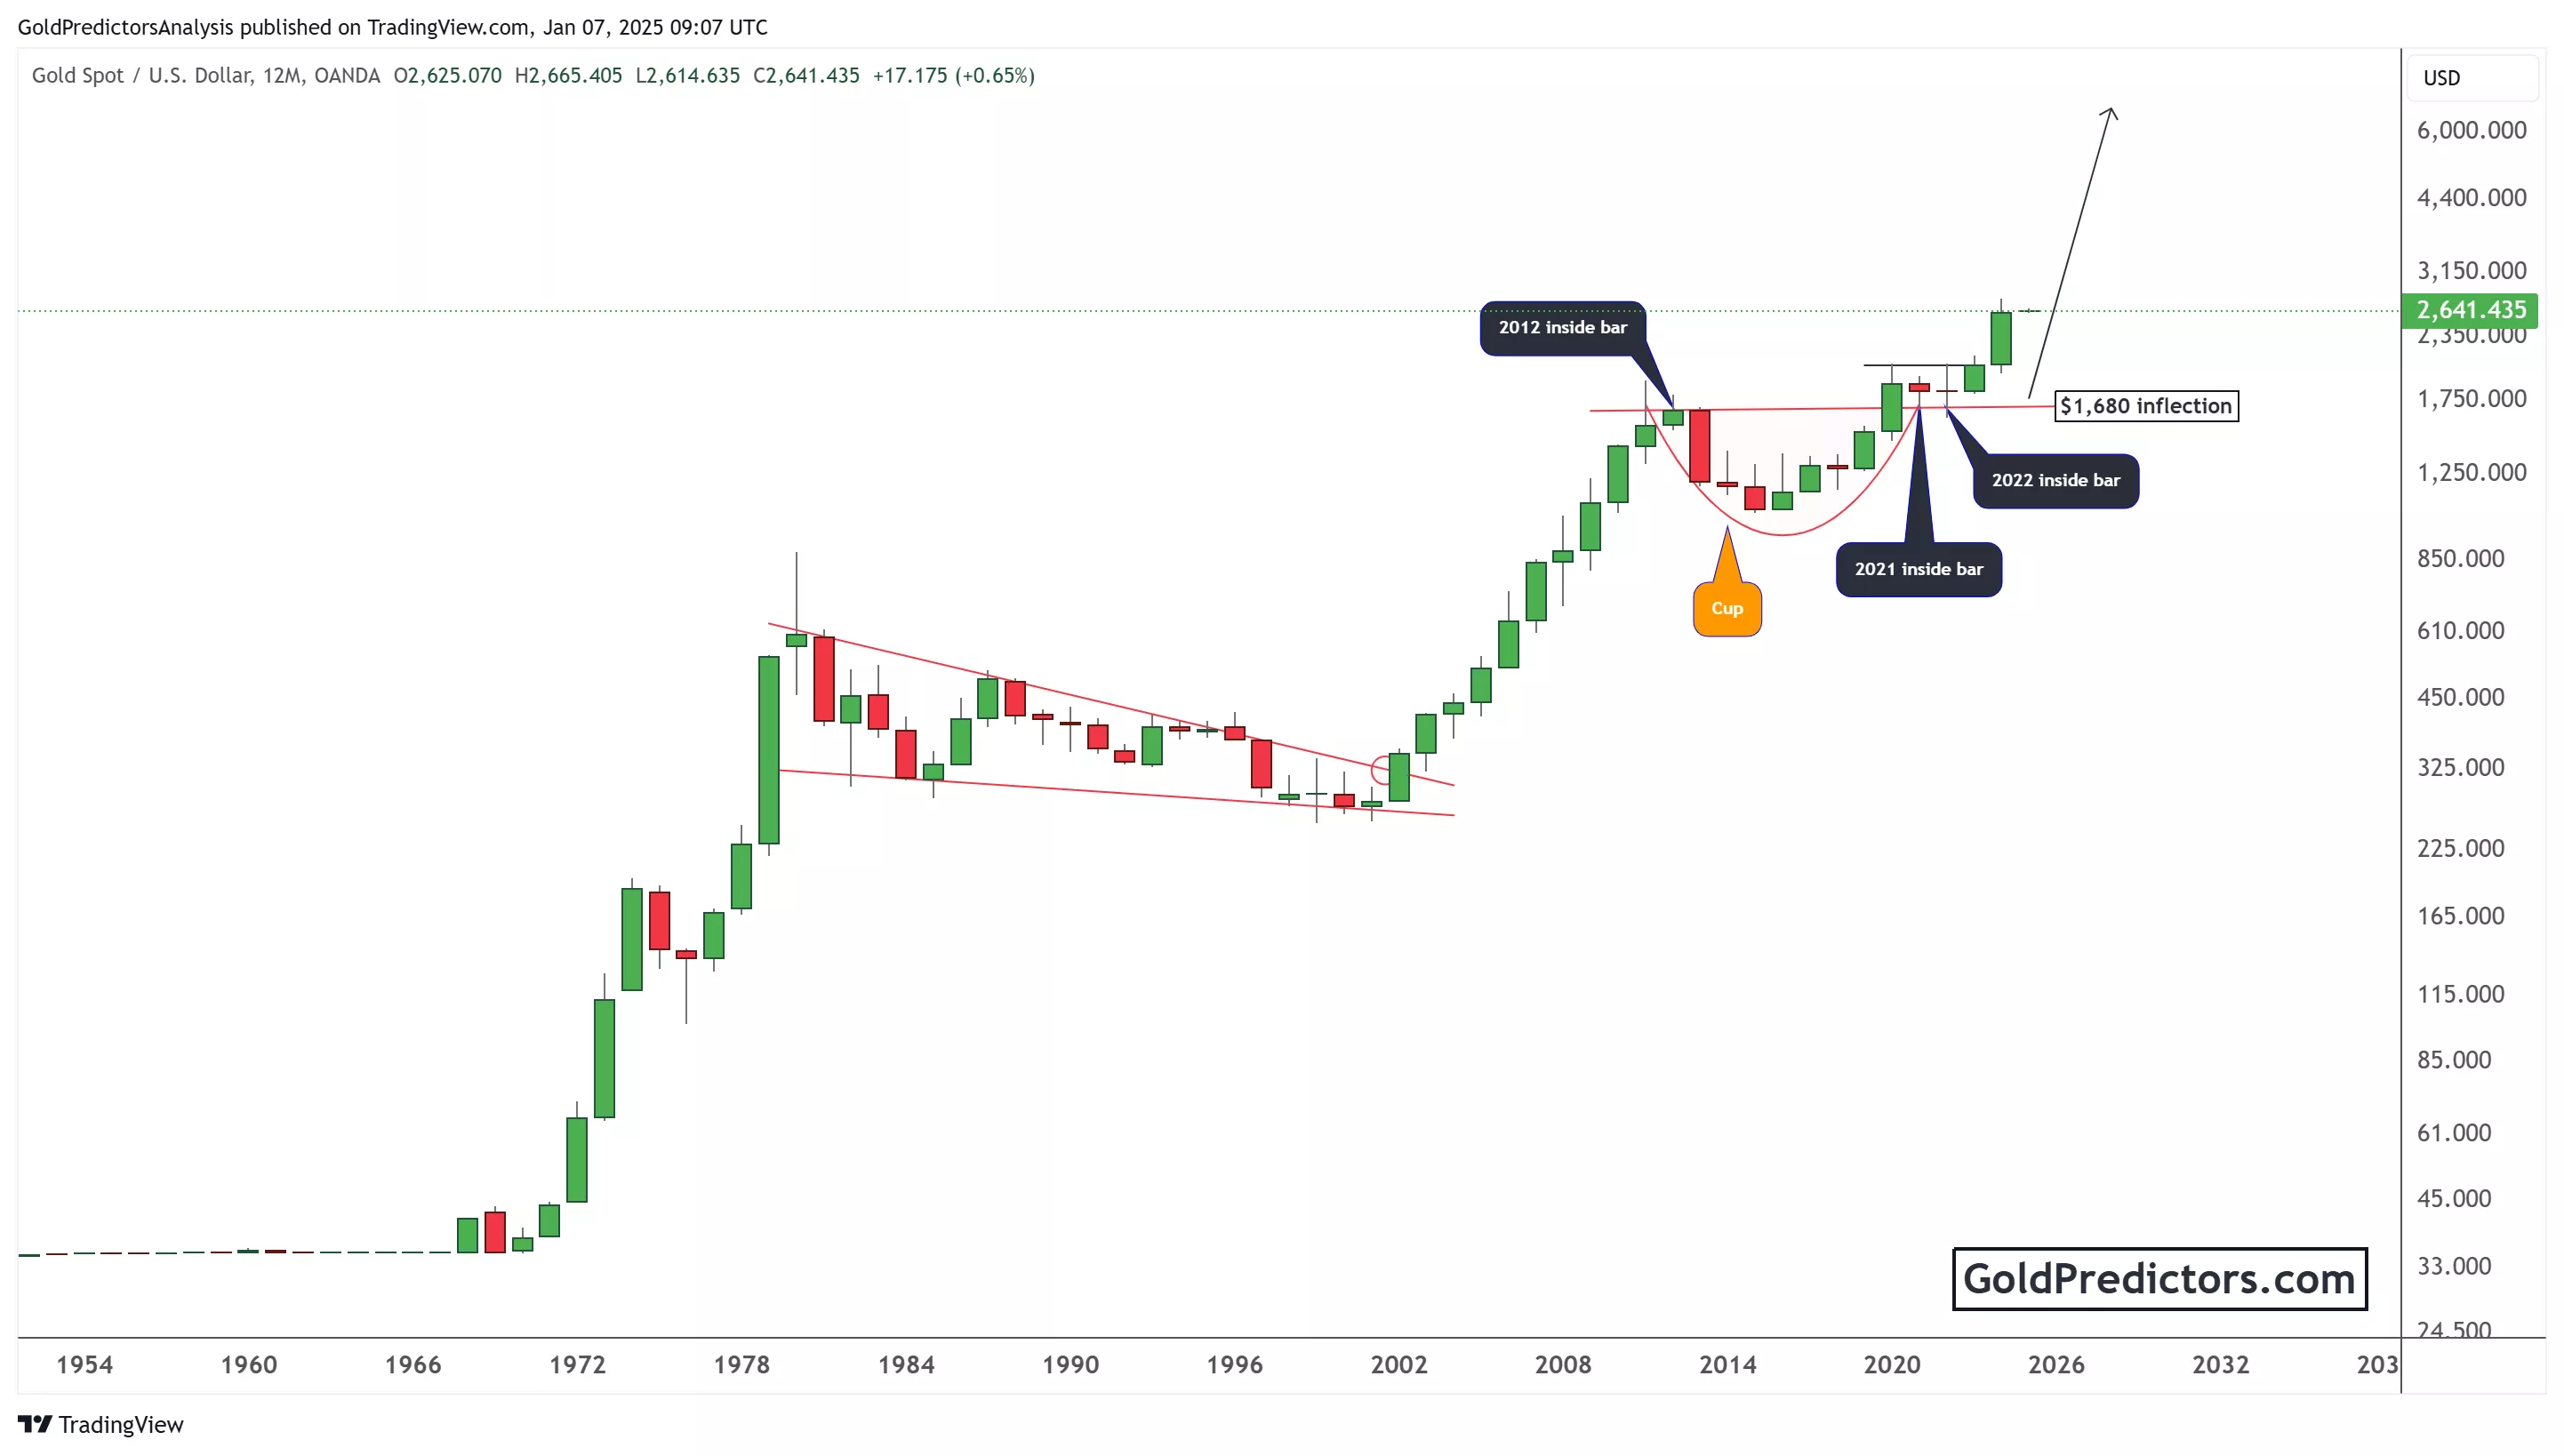
The yearly chart below provides a longer-term perspective, focusing on gold's price action since the mid-20th century. This chart reveals significant technical patterns, underscoring gold's capacity for sustained growth.
(Click on image to enlarge)

Key insights from the chart include:
- Cup-and-Handle Formation:
- The chart highlights a large cup-and-handle pattern spanning multiple years.
- This bullish continuation pattern often signals a major upward move upon completion.
- The breakout above $1,680, marked as the "inflection point," confirmed this pattern and triggered a rally to new highs.
- Inside Bars and Breakouts:
- 2012, 2021, and 2022 are marked by inside bars—candlestick patterns indicating price consolidation within a prior range.
- Breakouts from these inside bars served as launchpads for significant upward moves, reflecting renewed buying interest.
- Historical Trendlines:
- Long-term trendlines, such as the downward-sloping line from 1980 to the early 2000s, show gold's ability to overcome multi-decade resistance.
- The eventual breakout from this trendline marked the beginning of a prolonged bull market, with gold prices steadily climbing over the years.
Conclusion: Gold's Path Forward
The technical patterns and breakouts showcased in these charts highlight gold's strong upward momentum and its potential for further gains. Consolidation phases and subsequent breakouts indicate robust demand, while the long-term trajectory underscores gold's resilience as an asset class.
As we enter 2025, key factors include macroeconomic data, central bank policies, and geopolitical developments. These elements will likely influence gold's price dynamics, shaping its role as a hedge against inflation and economic instability.
In the short term, maintaining the current uptrend and establishing new support levels will be crucial for sustaining bullish momentum. On the other hand, the completion of significant technical patterns suggests that gold could achieve even higher price levels in the coming years.
Investors and traders should remain vigilant, leveraging technical analysis and macroeconomic insights to navigate gold's dynamic market. With its historical significance and proven track record, gold continues to shine as a cornerstone of diversified investment portfolios. To receive gold and silver trading signals please subscribe here.
More By This Author:
Gold Prices React To Fed Policy And Global Tensions: Key Insights For Traders
Gold Drops On Trump Victory As US Dollar Strengthens
Gold Holds Bullish Momentum Amid Short-Term Corrections
Disclosure: Materials distributed by GoldPredictors.com has no regard to the specific investment objectives, financial situation or the particular needs of any visitor or subscriber. This site ...
more


