Gold Prices May Fall Further As US Jobs Data Drives Fed Outlook
GOLD & CRUDE OIL TALKING POINTS:
- Gold prices drop with inflation bets as US data stirs Fed speculation
- Upbeat payrolls, wage growth numbers may keep gold under pressure
- Crude oil prices pierce chart resistance, WTI eyes test above $59/bbl
Gold prices sank as signs of economic recovery and warming price growth in the US stoked suspicions about the durability of ultra-loose Fed monetary policy. Tellingly, the 5-year breakeven rate – a proxy for priced-in inflation expectations – fell with the yellow metal as the data printed.
This hinted that investors read the figures as discouraging of stimulus expansion. In fact, some early threads of speculation about a shorter path toward tightening may be showing through despite the Fed’s protestations. Needless to say, this certainly wouldn’t be the first time traders challenged officials’ narrative.
Weekly jobless claims data showed 779k applications for benefits last week, an encouraging outcome relative to expectations of an 830k increase. Meanwhile, unit labor costs jumped 6.8 percent in the 6.8 percent in the fourth quarter, topping projections of a 4 percent gain.
GOLD PRICES MAY FALL FURTHER AS US JOBS DATA DRIVES FED OUTLOOK
Looking ahead, all eyes are on January’s US employment report. It is seen showing a 105k rise in nonfarm payrolls following December’s shock 140k drop. The jobless rate is seen holding unchanged at 6.7 percent. Leading ISM survey data suggests an upside surprise might be in the works.
January’s edition suggested the pace of job creation has returned to pre-Covid levels. Service-sector hiring growth jumped to the highest since February 2020 – just before the outbreak triggered lockdowns. Meanwhile, the manufacturing sector added staff at the fastest rate since June 2019.
An uptick in wage inflation may add to the Fed outlook implications of firm topline results. Hourly earnings are seen adding 5 percent on-year, a slight cooling compared with the 5.1 percent rise in December. Markit PMI data flagging the steepest costs rise since 2009 hint this too may overshoot however.
Gold is likely to fall further in such a scenario as the markets are encouraged to focus on the timeline for reducing stimulus – as opposed to expanding it – as the central object of speculation. This would understandably undermine the appeal of the non-yielding store of value alternative.
GOLD TECHNICAL ANALYSIS
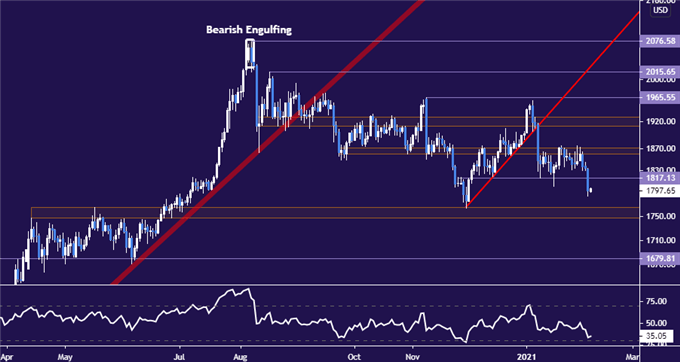
Gold prices have slipped back below inflection point support at 1817.13, opening the door for another test of the 1747.74-65.30 area. A daily close below that may set the stage for a probe below the $1700/oz figure. Alternatively, returning back above 1817.13 puts the 1860-71.34 zone back into focus as resistance.

Gold price chart created using TradingView
CRUDE OIL TECHNICAL ANALYSIS
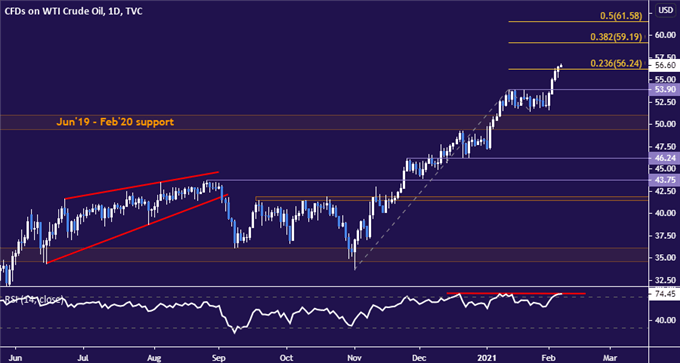
Crude oil prices have pushed north of the 23.6% Fibonacci expansion at 56.26, seemingly setting the stage for a run at the 38.2% level at 59.19. Stagnant RSI warns that momentum may be fragile however. Slipping back below 56.26 – now recast as support – sees the next downside hurdle at 53.90, a former resistance level.

Crude oil price chart created using TradingView
Disclosure: See the full disclosure for DailyFX here.


The Fed will stay accommodative for years to come - just remember how long it took Yellen Fed to make that baby step mid decade. The pace of job recovery (creation) is woefully slow. In gold, we're now at the deciding point whether we have seen the local, climactic low before stabilizing for quite a few sessions and going higher next, or whether we would get one more push lower a la Thursday from these levels, which means around $40 down, and that's it. Check out my daily writings should you want to, and have a good weekend!