
Gold Prices - Don't Get Too Excited
GOOD NEWS... The rebound in gold prices from their recent low has awakened new fervor among those looking for the elusive moonshot. The 'obvious' signs of much higher inflation have emboldened those who are inclined to predict ever higher gold prices.
Contrastingly, the chart of GLD prices pictured below doesn't look all that great...
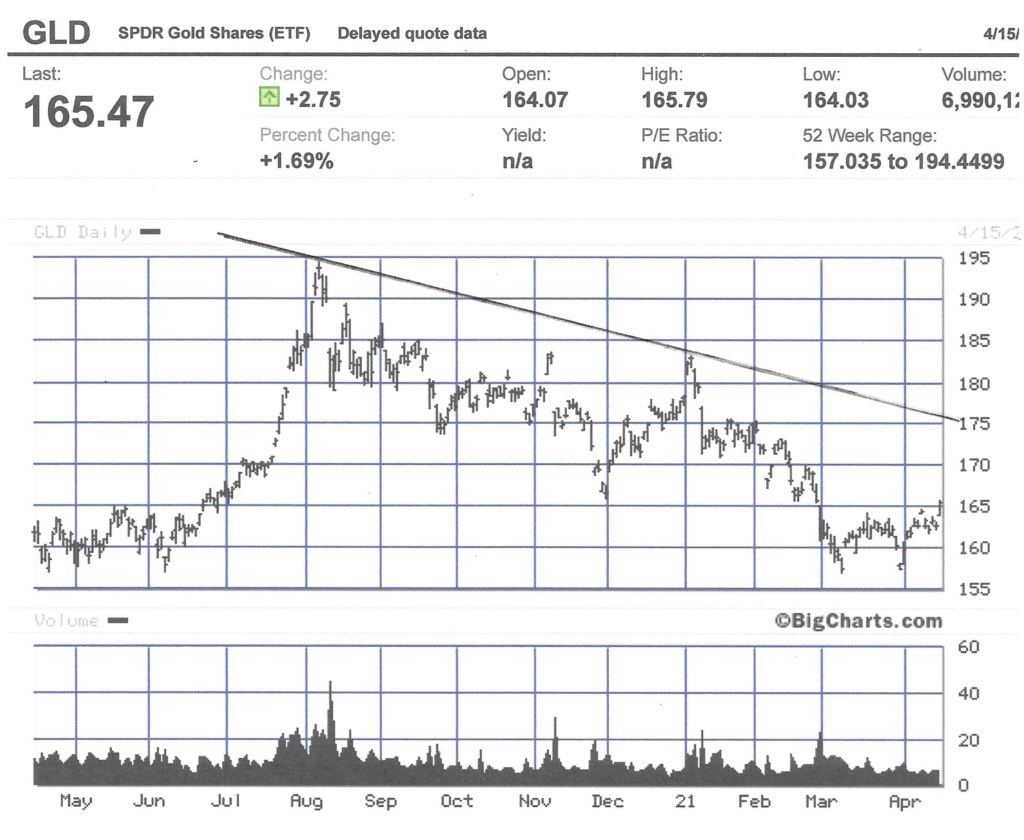
At this point, a further one-hundred-dollar increase in the price for gold (GLD) will not break the downtrend line of overhead resistance dating back to August 2020.
For some additional perspective, here is a chart (source) of gold prices for the past ten years...
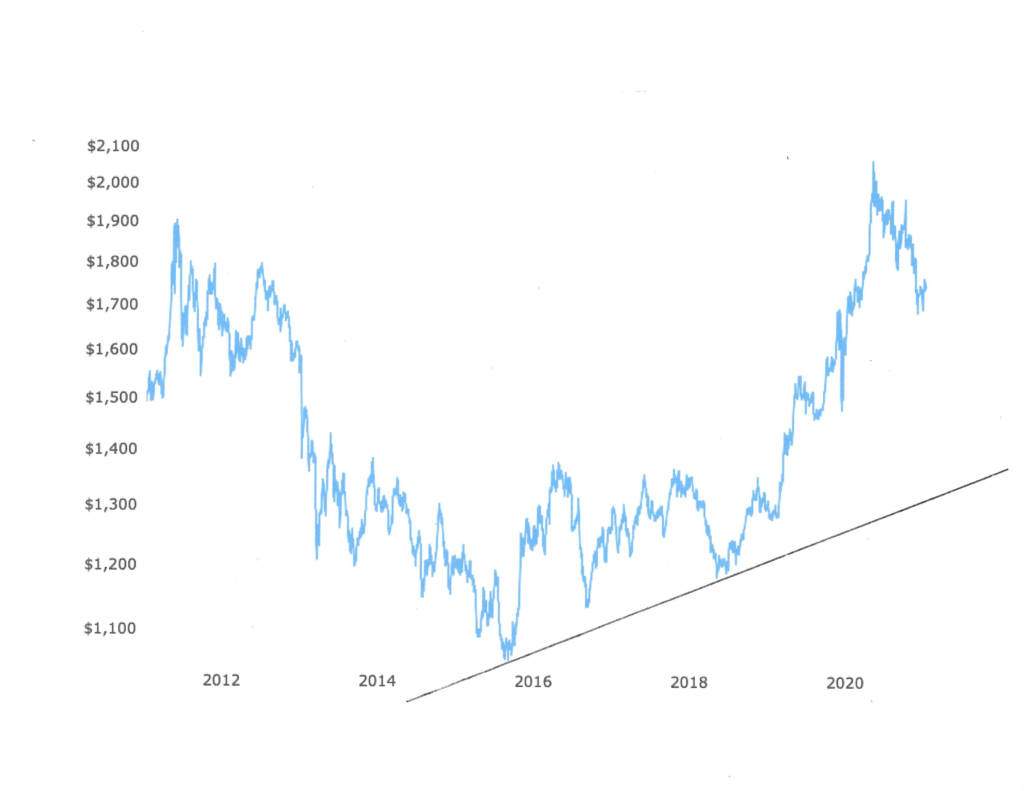
The magnitude and severity of gold's price decline is quite apparent. Also, the potential for further downside shouldn't be dismissed.
As it is, the price of gold could decline back to $1330-1360 without breaking the ascending line of support which dates back to December 2015; which happens to be the point where gold reached its lowest price after peaking in August 2011. That's the good news.
BAD NEWS
Below is a one hundred-year history of gold prices...
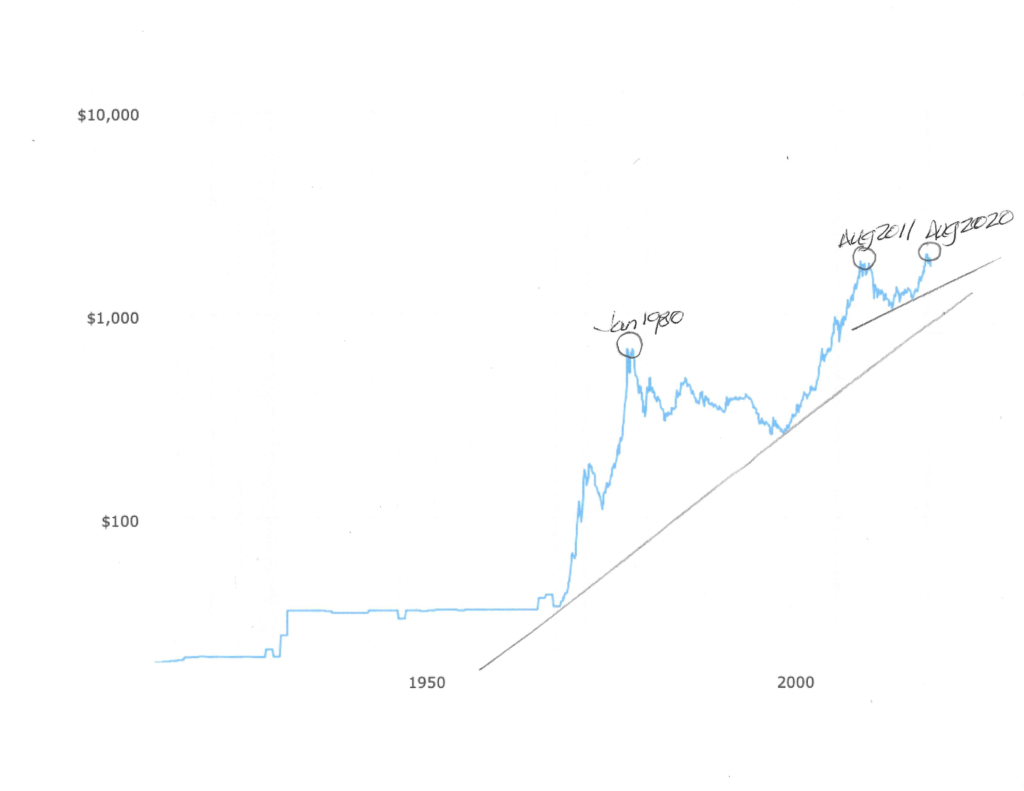
On this chart, the long-term ascending rise in gold prices has a line of support dating back to 1970.
Assuming that the ascending line of support is a valid reference point for analyzing gold's price movements over the past half-century, then gold's price trend is well-supported.
But, the line of support shown in chart no. 2 previously, and again in the chart immediately above, is not as long in duration and not likely as strong. Hence, the possibility of gold prices below $1300 is not remote.
In fact, if gold prices are unable to hold support at the $1330 - $1360 level, then a decline to just above $1000 per ounce becomes a strong possibility.
MORE BAD NEWS
Our final chart is also a one-hundred-year history of gold prices, this time inflation-adjusted...
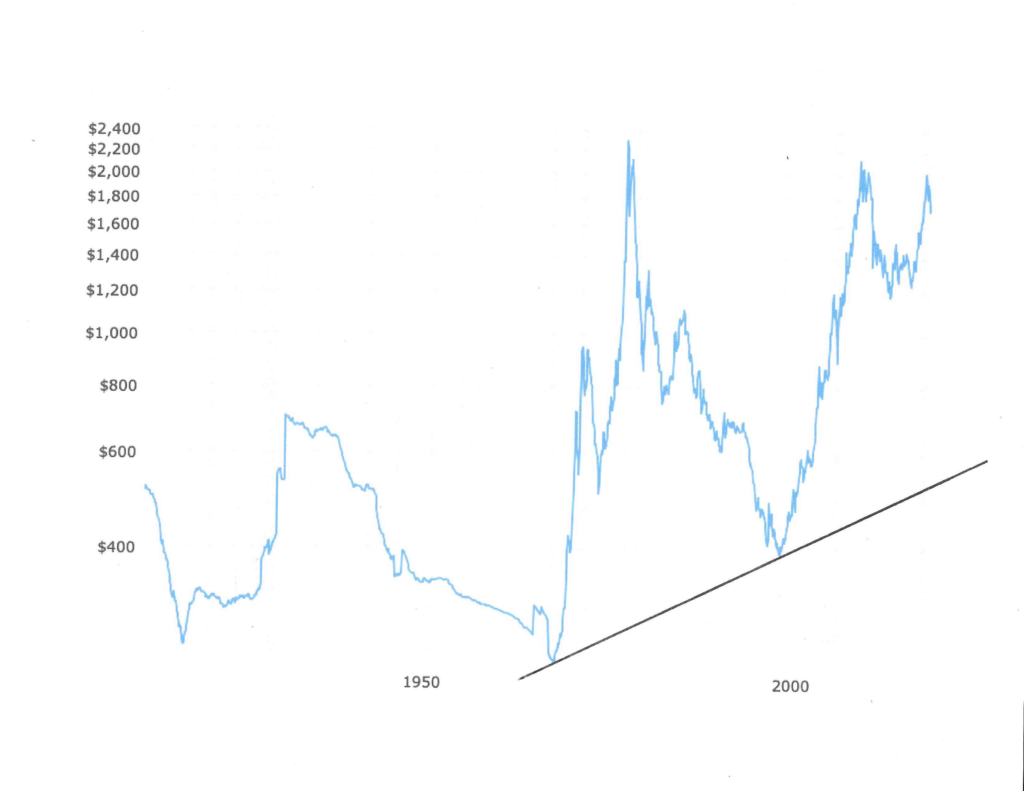
Again, referencing the same line of support dating back to 1970, and allowing for the possibility of the gold price not holding the five-year line of support in the mid $1300s (if it gets that low), then the new potential downside price target for gold is closer to $600 per ounce.
That is a sobering thought if you are betting on much higher gold prices. Also consider that in real terms, after allowing for the effects of inflation, gold at $2000 per ounce today is cheaper than it was at $600 per ounce in 1980.
Kelsey Williams is the author of two books: INFLATION, WHAT IT IS, WHAT IT ISN'T, AND WHO'S RESPONSIBLE FOR IT and more


That last paragraph is the most disturbing, as it points clearly at the damage done by inflation. Taking our dollar off the gold standard was the start of the fed being able to do far more serious damage to the USA economy, and also damage other economies around the world. Sort of like an atomic bomb, except slower and more subtle.
And clearly the demand for gold is based quite a bit on how much folks are hedging against the anticipated inflation. We all know that it is coming, but we don't know exactly when, nor how bad it will be this time.