
The gold price has been steady to start the week after it sunk on Friday as Treasury yields got a lift from slightly better than anticipated US jobs data. Non-farm payrolls grew by 263k job in September instead of 255k forecast.
The buoyant labour market gives the Federal Reserve more scope to maintain their aggressive monetary policy tightening agenda. Last week saw a consistent line up of Fed speakers all with the same message - rates are going to be high for as long as it takes to rein in the hottest inflation for 40-years.
A number of the speakers said that they don’t see rate cuts happening in 2023. The higher Treasury yields hoisted the US Dollar, further undermining the precious metal.
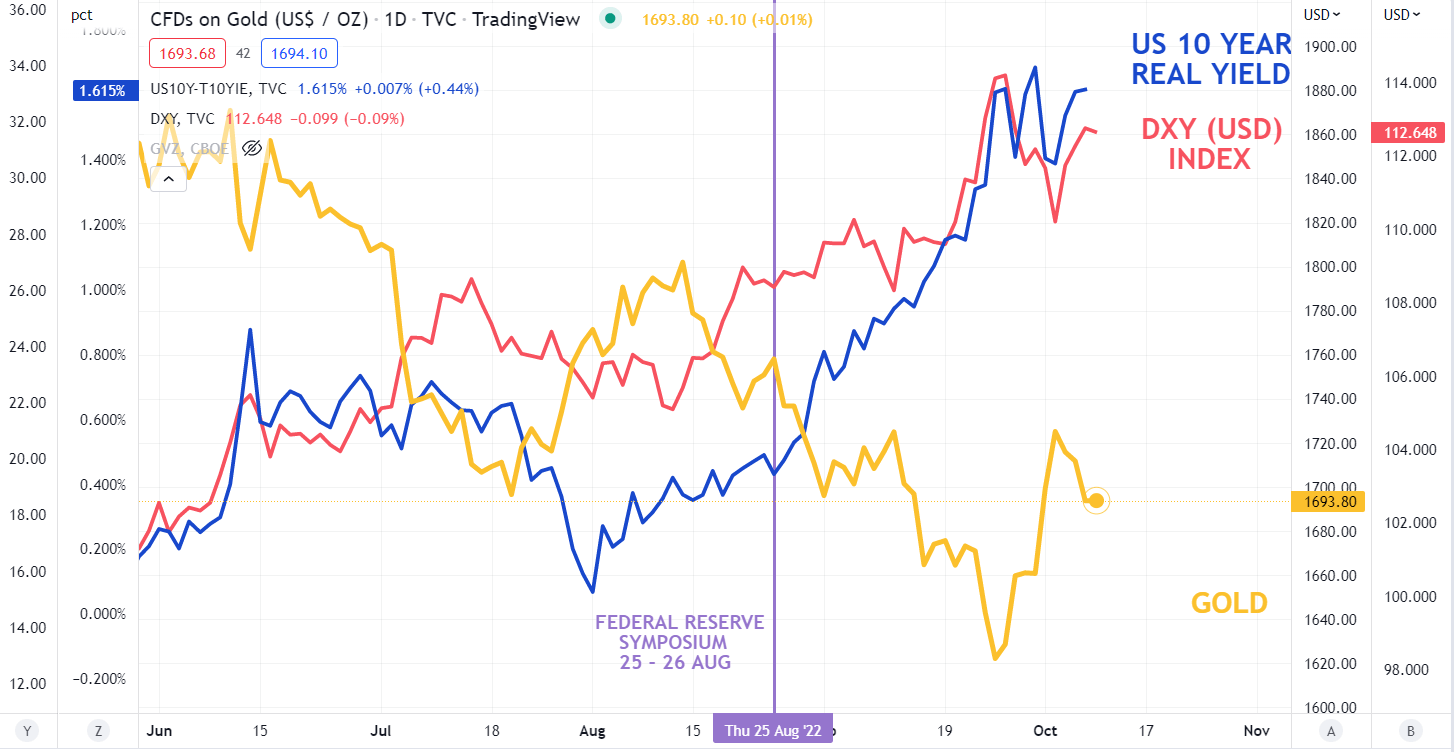
Crucially for the gold price, while nominal yields marched north, breakeven inflation rates remained fairly static, pushing up real yields. The benchmark 10-year Treasury note is eyeing a move toward the 12-year high seen last month above 4%.
Looking ahead, US CPI is due out on Thursday with the year-on-year increase in prices anticipated to be 8.1% to the end of September according to a Bloomberg survey of economists.
This is well above the Fed’s goal of maintaining CPI to be around 2% and explains the hawkish stance of the central bank.
Gold Against US 10-Year Real Yield, USD (DXY) Index And Volatility (GVZ)
(Click on image to enlarge)
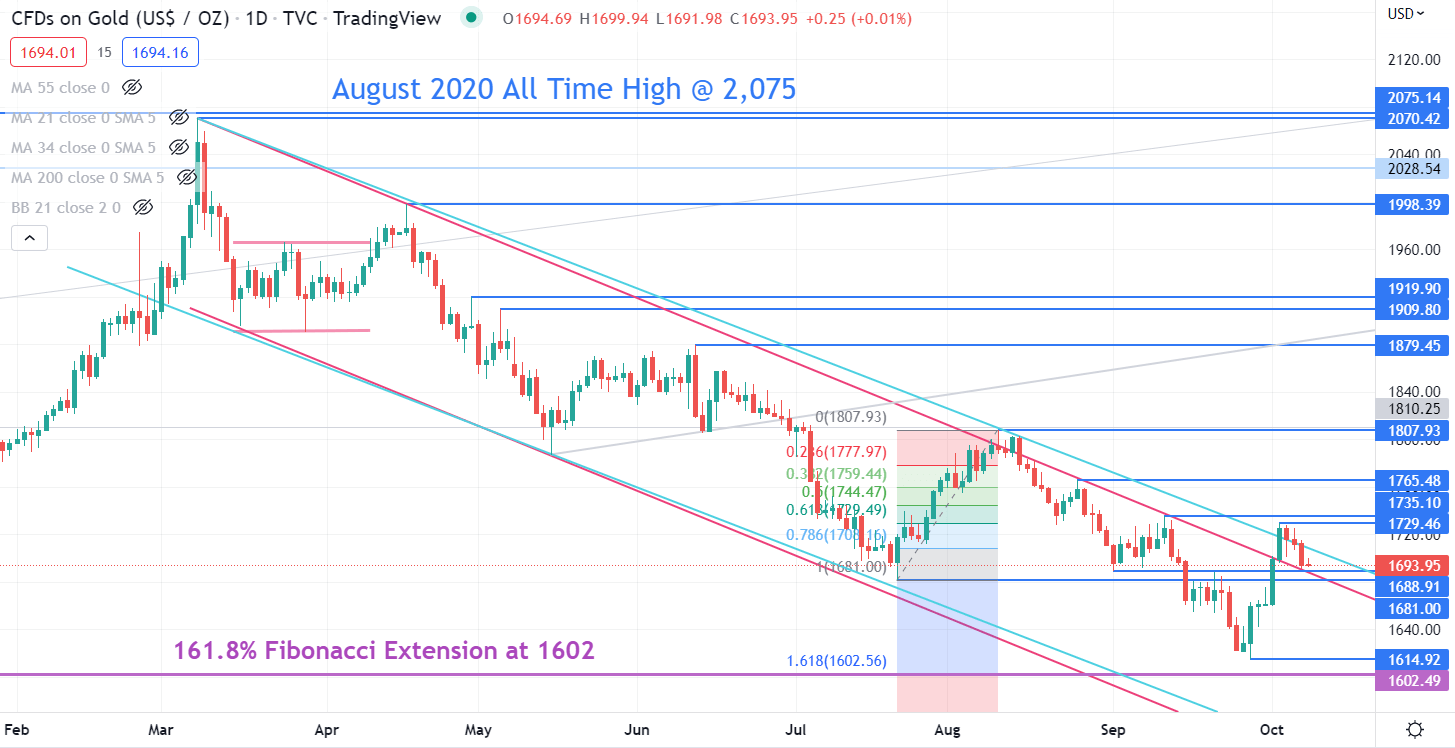
Gold Technical Analysis
Gold’s stellar rally to start October came to an end last week after making a peak at 1730 which was just shy of the September high of 1735.
These levels may offer resistance as well as the previous tops at 1765, 1808 and 1880.
The move up last week managed to get above a descending trend line, but it has fallen back below it. A similar topside blow off can be seen in August where it broke above a descending trend line before collapsing to a 2-year low. This recent price action might also turn out to be a false break.
The low seen on Friday of 1690 was just above a break point at 1689 and these levels may provide support.
Further down, support could be at the recent low of 1615 or a Fibonacci extension level at 1602.
(Click on image to enlarge)
More By This Author:
AUD/USD Eyes Consumer Confidence Data Ahead Of US CPI
S&P 500, Dow Jones, Nasdaq Directional Fate Tied To CPI After NFP Selloff
Dow’s Near Record Reversal Dashes Bullish Hopes Before New Growth, Financial Warnings


Comments
Log in or sign up to join the conversation.