

Dow: The Strong Start to October and Q4 Fell Apart Quickly
This past week ended on a very different note with risk trends than where it opened. Considering the week was also the start of a new month (October) and the fourth quarter, there was a particular seasonal influence at work. In the transition between quarters, there are accounting and other fund rebalancing activities that tend to create predictable tides in benchmark risk assets. At the start of the new period, a reallocation of capital can produce an artificial inflation in capital markets at large. That said, that current will last for only so long, and genuine fundamentals need to eventually take over for a productive run. In this most recent case, the influx of capital was present with the biggest two-day S&P 500 rally since the post-pandemic transition. Yet, follow through absolutely fell apart. While the tumble in the second half of this past week wouldn’t really gain traction until after the September NFPs, the turn was impressive nonetheless. For scale on the intraweek reversal, the Dow Jones Industrial Average posted its largest ‘upper wick’ this past week (1,158) since March 2, 2020 – and the second largest on record. The about face effectively quashes the nascent risk appetite run, but a true bear run – or any directional move from here – likely requires a true fundamental patron.
Chart of Dow Jones Industrial Average, 20 Week SMA and Weekly ‘Wicks’ (Weekly)
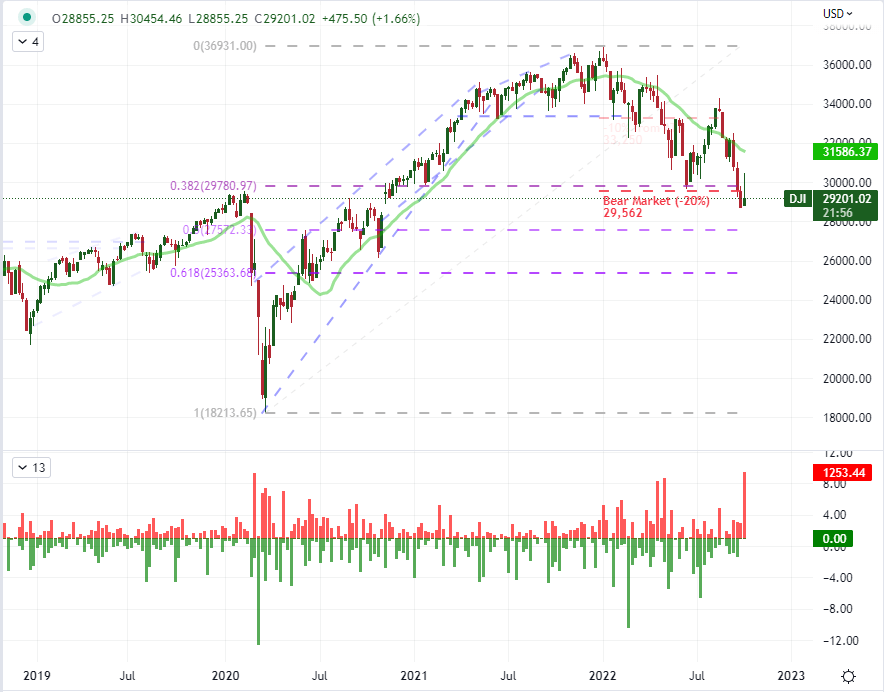
Chart Created on Tradingview Platform
Given our circumstances at present, I believe there is a lot of deep fundamental trauma for the markets to draw upon to determine our progress. Yet, before we start to break down the Fed’s commitment to its inflation fight or the probability of an intense recession moving forward, it is important to assess the seasonal circumstances that we will see push and pull on the markets ahead. Many retail traders would fixate on the historical averages on weekly S&P 500 performance. The 40th week of the year – which we just closed out – has averaged a modest gain back to 1900 following a three-week slide. That happens to line up to what we have seen in 2022. Following the course moving forward, history suggests another three weeks of slide ahead, but the dispersion of historical performance is far to significant to make this a reliable measure. On the other hand, the history of a historical peak in volume for the S&P 500 in October and VIX to peak in weak 41 tends to carry less of the baggage of year-to-year thematic changes. I’m keeping tabs on volatility moves towards the 50-mark for signs of capitulation. Short of that, the fire is more likely to burn more steadily over time.
Chart of VIX Volatility Index and Historical Seasonal Weekly Average (Weekly)
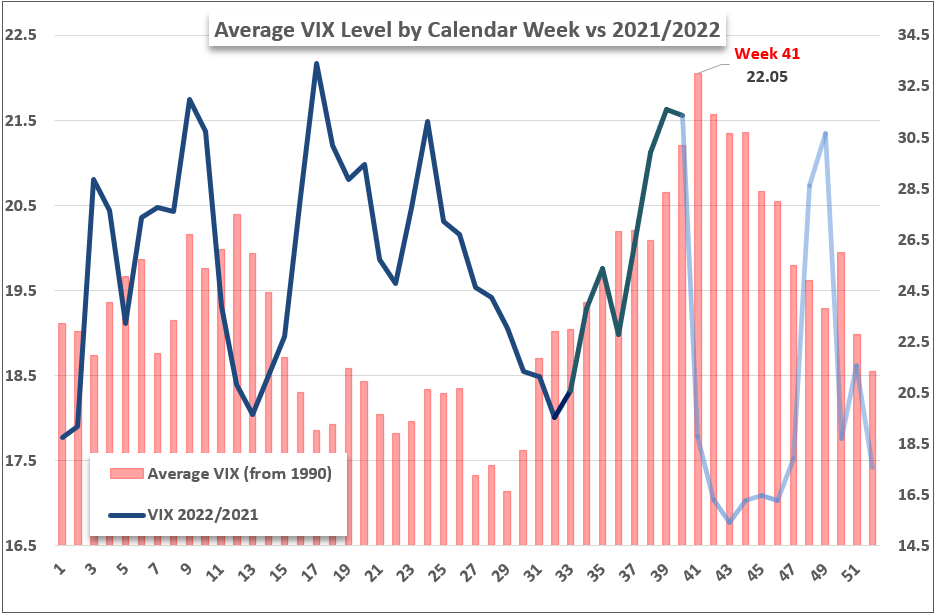
Chart Created by John Kicklighter
The Fundamental Waters Deepen Ahead
Through this past week, there wasn’t a lot of tending to the systemic fundamental themes. That probably allowed the seasonality aspects underlying the market to dictate market activity a little more actively. The fundamental agnosticism changed though through this past Friday’s session. The US nonfarm payrolls report is one of the most market moving indicators in the global financial system, and the attention paid towards the reading this month was particularly intense. After a mix of outcomes from preceding releases (job openings, ADP payrolls and ISM service sector employment figure), there was serious potential in the form of volatility following this event. Ultimately, the payrolls were largely in-line at 263,000 jobs added for the month and a 0.2 percentage point drop from the jobless rate to 3.5 percent. That would seem an underwhelming report if not for a backdrop for which the Fed has reiterated a commitment to bring down rampant inflation at the expense of economic expansion and even financial security.
Chart of Change in US Unemployment Rate, CPI YoY and Effective Fed Funds Rate (Monthly)
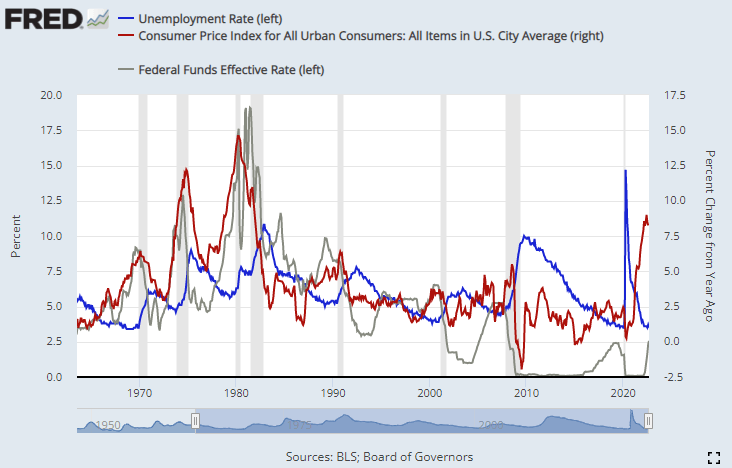
Chart Created by John Kicklighter with Data from BLS and ADP
From what we have heard from different federal reserve members (regional heads and board members), there is a willingness to accept an economic swoon and certainly a market tantrum to keep up the inflation fight. Fed officials have made very clear that they are willing to tolerate a lot in order to cap rampant price growth as the cost to fix on-set inflation is seen as markedly worse for financial markets’ health. In the meantime, we are due an update on where we stand economically from the IMF’s World Economic Outlook (WEO). Officials have already warned that another significant downgrade is ahead. Many will look to the relative views of regions in a provocation of an FX par for example, but I will be looking to this outlook with an eye to the global picture of growth and stability.
IMF Growth Forecasts from July Economic Update with Changes from April WEO
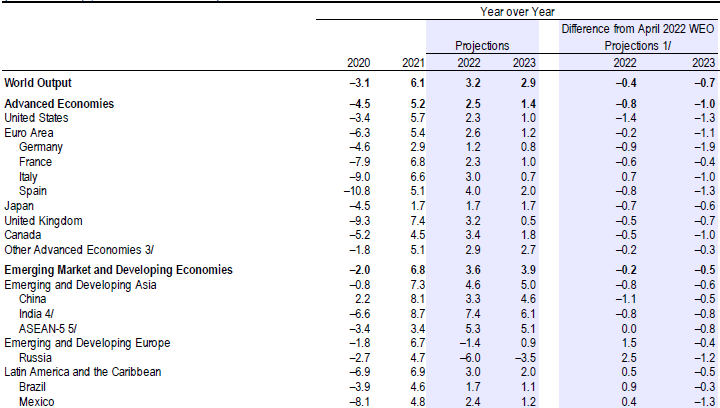
Table from IMF Interim WEO
USDJPY Pressure Builds with Plenty of Event Risk on Tap
Heading into the new trading week, I will be particularly focused on the volatility risk associated to the high level event risk on tap. That said, the backdrop market conditions could do far more than the impact of a scheduled event risk. Regardless of the catalyst, the Dollar’s buoyancy has done a serious number on USDJPY. The Japanese Ministry of Finance announced clearly the past week that it was intervening on behalf of the Yen. The market’s took notice and curbed their speculative efforts…for a short while. The pairs counter-trend wobble lasted for 24-48 hours and then we were back within the vicinity for the line in the sand that we have been keeping tabs. A subsequent intervention is a high probability moving forward, but the effectiveness of such efforts is unlikely to change.
Chart of USDJPY with 20-Day SMA and 9-Day Historical Range and ATR (Daily)
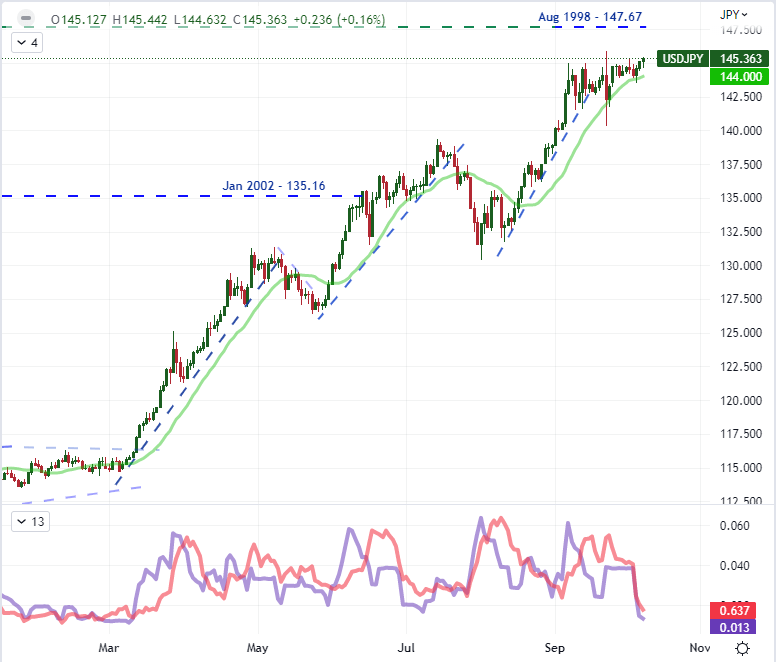
Chart Created on Tradingview Platform
In general, I am concerned about the excess leverage employed across the global financial system from consumers to corporate giants to governments to central banks and investors. As rates rise, the cost associated rises in tandem. I have taken careful note of the warnings of financial stability that are starting to show around the periphery. In the week ahead, we will have event risk that taps directly into the bigger concerns around the health of the world economy and its financial stability. The semi-annual update on the WOE (World Economic Outlook) and GFSR (Global Financial Stability Report) will project an critical fundamental weight moving forward. If you’d look for other fundamental catalysts had, the density of central bank speak and US CPI are important updates. That said, next to the IMF’s updates, I would put US bank earnings on Friday in the second spot of market moving potential.
Critical Macro Event Risk on Global Economic Calendar for Next Week
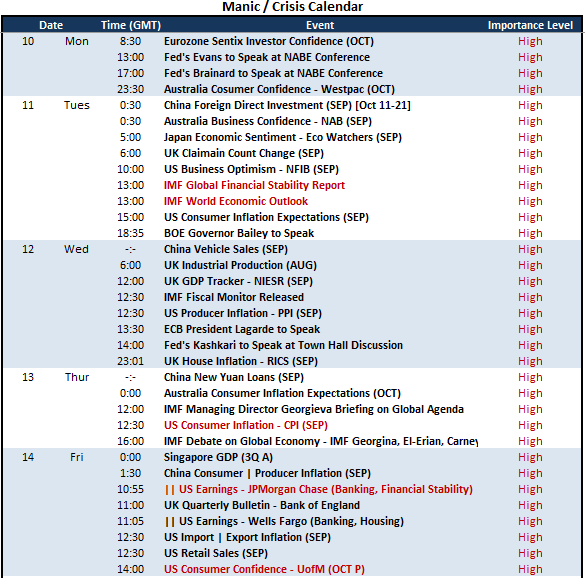
Calendar Created by John Kicklighter
More By This Author:
Bitcoin And Ethereum Forecast For The Week AheadCanadian Dollar Forecast: Us Inflation Data To Set The Tone For USD/CAD
S&P 500, Dow And Nasdaq Under Pressure, USD Stands Tall As Sentiment Sours


Comments
Log in or sign up to join the conversation.