

The price of gold appears to be reversing course following the failed attempt to test the yearly low ($1615), but the precious metal may largely mirror the price action from earlier this month if it struggles to push above the moving average.
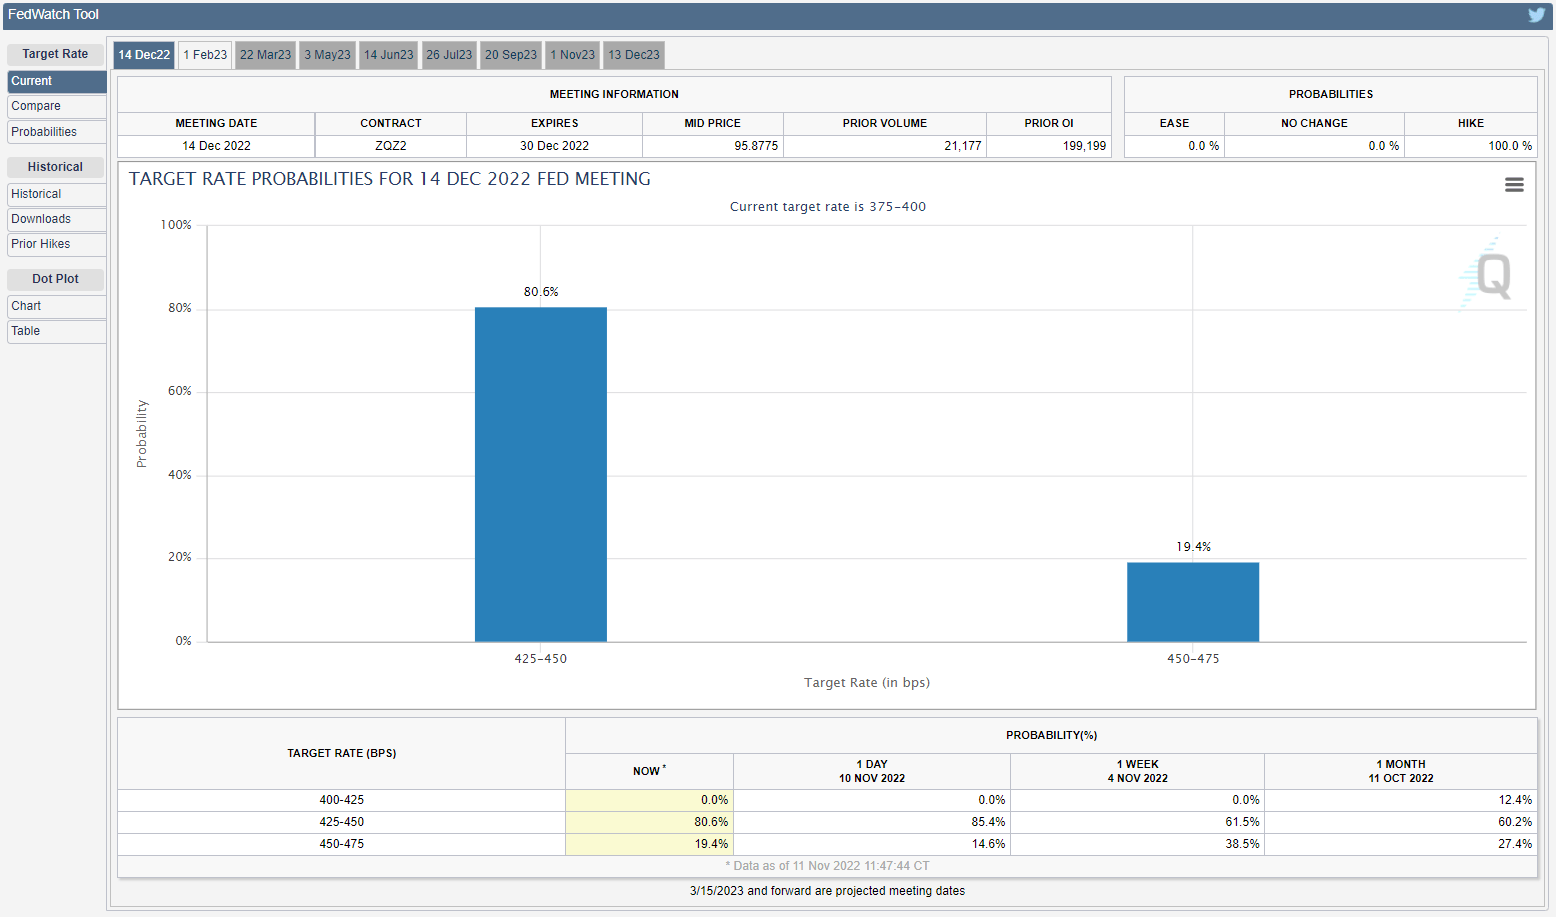
As a result, the price of gold may continue to track the negative slope in the moving average with the Federal Reserve on track to implement higher interest rates next month, and the update to the US Personal Consumption Expenditure (PCE) Price Index may encourage Chairman Jerome Powell and Co. to retain their existing approach in combating inflation as the Fed’s preferred gauge for inflation is expected to widen for the second consecutive month.
(Click on image to enlarge)
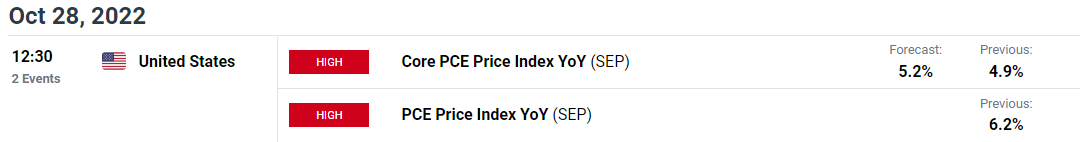
The core PCE is projected to increase to 5.2% in September from 4.9% per annum the month prior, and evidence of persistent inflation may fuel speculation for another 75bp Fed rate hike as the central bank pursues a restrictive policy.
In turn, the development may drag on gold prices as the precious metal reflects an inverse relationship with US yields, and bullion may face headwinds ahead of the Federal Open Market Committee (FOMC) interest rate decision on November 2 as the central bank plans to carry its hiking-cycle into 2023.
With that said, the failed attempt to test the yearly low ($1615) may lead to a test of the 50-Day SMA ($1689) as the price of gold trades to a fresh weekly high ($1675), but the precious metal may mirror the price action from earlier this month if it struggles to push above the moving average.
Gold Price Daily Chart
(Click on image to enlarge)
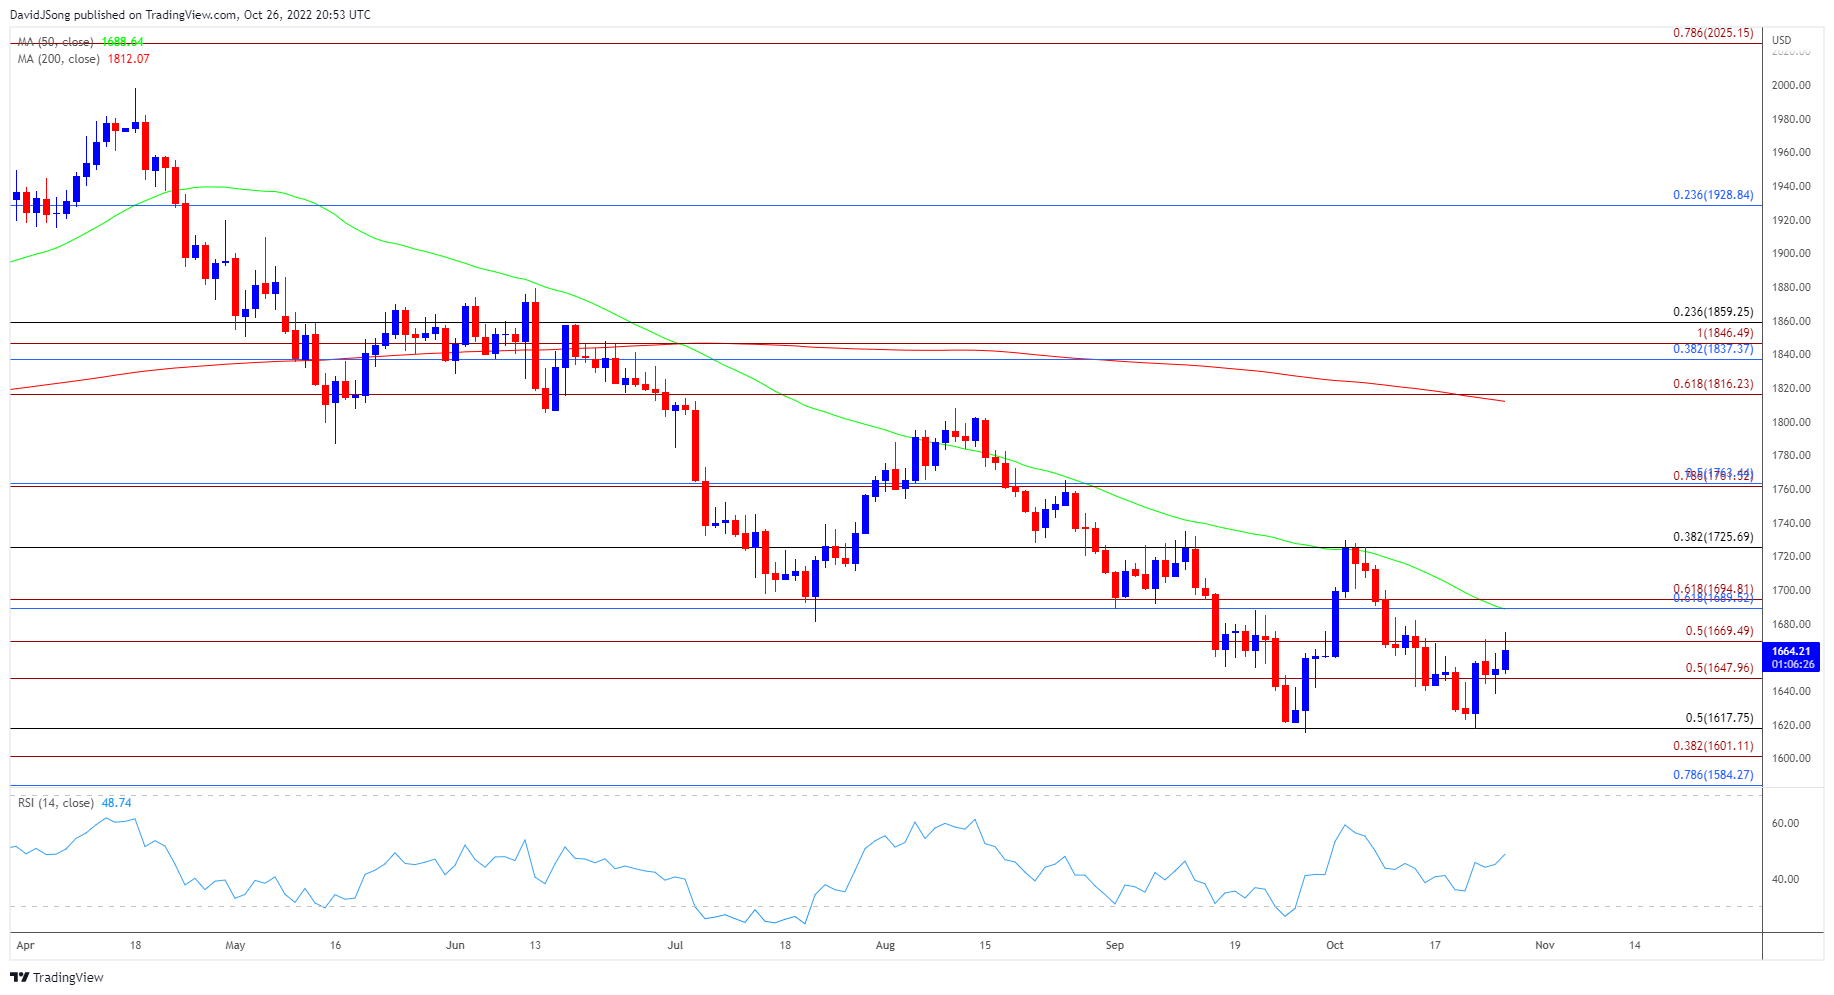
Source: Trading View
- The price of gold appears to have reversed course ahead of the yearly low ($1615), with bullion initiating a series of higher highs and lows as it trades to a fresh weekly high ($1675).
- A close above $1670 (50% expansion) brings the $1690 (61.8% retracement) to $1695 (61.8% expansion) region on the radar, which lines up with the 50-Day SMA ($1689), with a move above the moving average opening up the $1726 (38.2% retracement) area.
- However, bullion may track the negative slope in the moving average to larger mirror the price action from earlier this month, and the failed attempts to close above $1670 (50% expansion) may push the price of gold below the $1648 (50% expansion) region to bring the yearly low ($1615) back on the radar.
More By This Author:
EUR/USD On Track To Clear Monthly Opening Range Ahead Of ECB Meeting
Gold Price Reverses Ahead of Yearly Low to Eye 50-Day SMA
USD/JPY Susceptible To Larger Pullback As RSI Falls From Overbought Zone

Comments
Log in or sign up to join the conversation.