
USD/JPY appears to have reversed course ahead of the July 1990 high (152.25) as it initiates a series of lower highs and lows, and the move below 70 in the RSI is likely to be accompanied by a near-term correction in the exchange rate like the price action seen during the previous month.
As a result, USD/JPY may continue to pullback ahead of the Bank of Japan (BoJ) interest rate decision as the 12 day rally unravels, but more of the same from Governor Haruhiko Kuroda and Co. may produce headwinds for the Japanese Yen as the central bank sticks to the Quantitative and Qualitative Easing (QQE) program with Yield-Curve Control (YCC).
(Click on image to enlarge)

In turn, the Yen may continue to underperform against the Greenback as the BoJ remains reluctant to shift gears, and the decline from the yearly high (151.94) may end up being short-lived as the Federal Reserve pursues a restrictive policy.
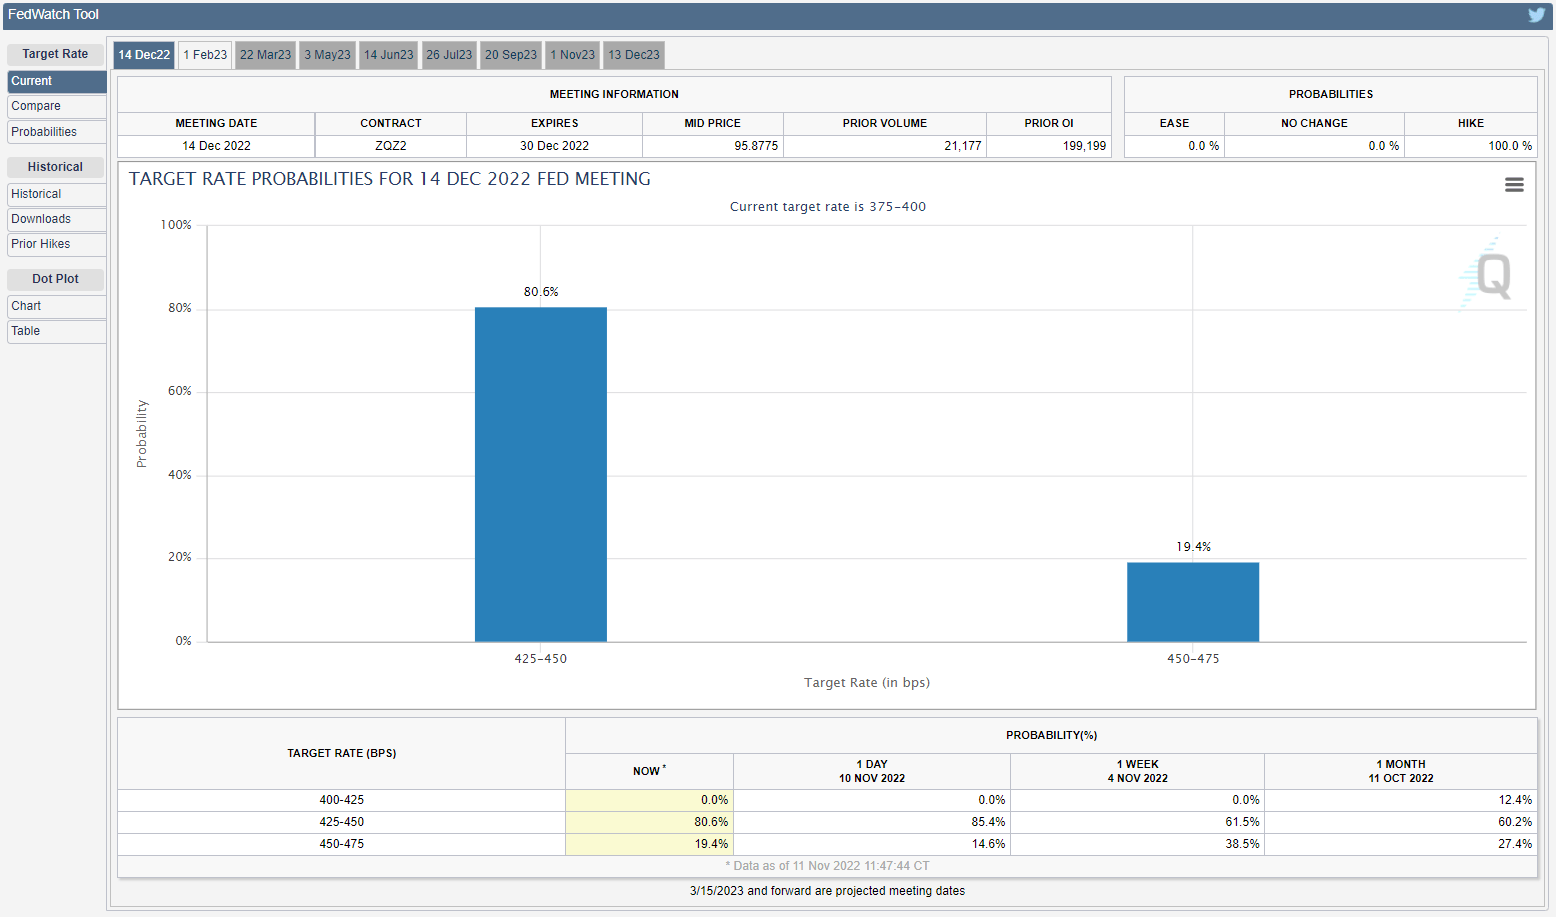
The diverging paths between the BoJ and Federal Open Market Committee (FOMC) is likely to keep USD/JPY afloat as Chairman Jerome Powell and Co. appear to be on track to deliver another 75bp rate hike at the next interest rate decision on November 2, while the tilt in retail sentiment looks poised to persist as traders have been net-short the pair for most of 2022.
(Click on image to enlarge)
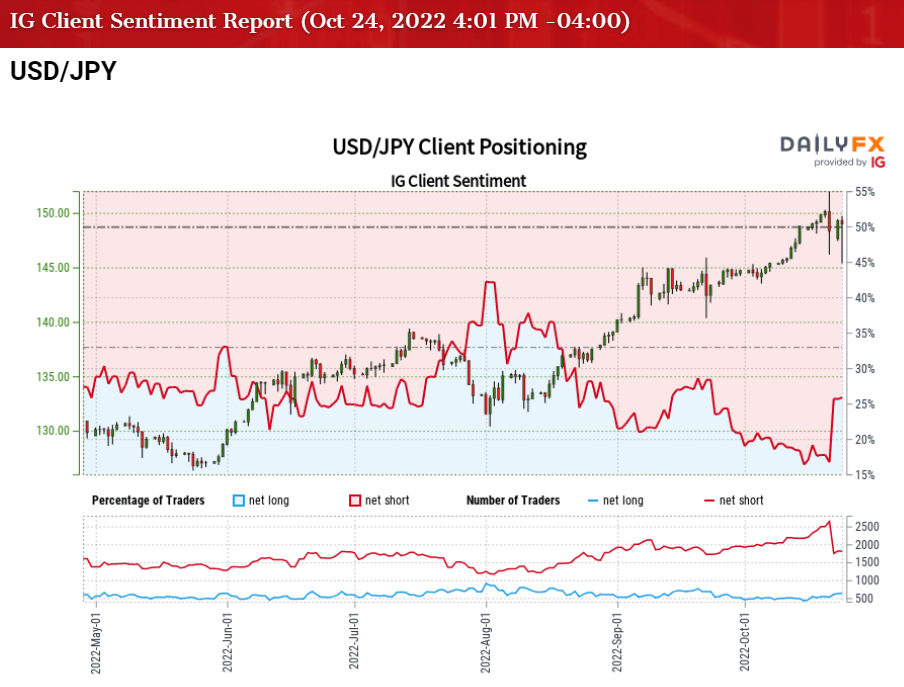
The IG Client Sentiment (IGCS) report shows 22.42% of traders are currently net-long USD/JPY, with the ratio of traders short to long standing at 3.46 to 1.
The number of traders net-long is 6.22% higher than yesterday and 12.41% higher from last week, while the number of traders net-short is 17.02% higher than yesterday and 11.43% lower from last week. The rise in net-long interest has helped to alleviate the crowding behavior as only 18.55% of traders were net-long USD/JPY last week, while the decline in net-short position comes as the exchange rate initiates a series of lower highs and lows.
With that said, USD/JPY may face a larger pullback ahead of the BoJ meeting as the RSI falls back from overbought territory, but the exchange rate may stage further attempts to test the July 1990 high (152.25) as the FOMC plans to carry its hiking-cycle into next year.
USD/JPY Rate Daily Chart
(Click on image to enlarge)

Source: Trading View
- USD/JPY initiates a series of lower highs and lows after failing to test the July 1990 high (152.25), with the move below 70 in the Relative Strength Index (RSI) likely to be accompanied by a larger pullback in the exchange rate like the price action from last month.
- Lack of momentum to trade back above the 150.00 (38.2% retracement) handle may push USD/JPY towards the August 1998 high (147.67), with a move below the 144.10 (100% expansion) area opening up the monthly low (143.53).
- Need a move back above the 150.00 (38.2% retracement) handle to bring the yearly high (151.94) on the radar, with a break above the July 1990 high (152.25) opening up the 155.10 (161.8% expansion) area.
More By This Author:
USD/CAD To Eye Yearly High On Smaller BoC Rate HikeAUD/USD Outlook Mired by Failure to Push Back Above September Low
Gold Price to Fall Towards April 2020 Low on Failure to Defend Yearly Low

Comments
Log in or sign up to join the conversation.