

Image Source: Pixabay
Gold price retreated from last Friday’s highs of $1872.22 and dropped toward the $1850 area on Monday despite the US Dollar (USD) fall, ahead of a vital inflation report from the United States (US). Additionally, US Treasury yields, albeit edging down, remain at around five-week highs. At the time of writing, the XAU/USD is trading at $1852.88.
Gold retraces to $1850 weighed by a risk-on mood
XAU/USD remains pressured, while the US Dollar Index, a measure of the buck’s value vs. a basket of peers, drops 0.18%, down at 103.391, undermined by the US 10-year Treasury bond yield, with the 10-year benchmark not dropping one and a half bps to 3.726%.
Investors are awaiting a report from the Bureau of Labor Statistics (BLS) onTuesday, revealing the Consumer Price Index (CPI) for January, estimated at 6.2% YoY, lower than the 6.5% in December. The core CPI excludes volatile items like food and energy, which is foreseen at 5.5% YoY, from 5.7% in the previous month.
In the meantime,Fed hawkish commentary continued with the Fed Governor Michell Bownman, who said that the Federal Reserve (Fed) needs to continue to raise rates to get the Federal Funds Rate(FFR) to a sufficiently restrictive level, as the US central bank battles high inflationary pressures.
Of late, the US Federal Reserve of New York revealed inflation expectations for the year hold steady at 5%. For a three-year horizon, the poll showed that inflation would stand at 2.7%, down from December 2.9%, while for a five-year span, it was projected at 2.5%, vs. 2.4 in the prior month.
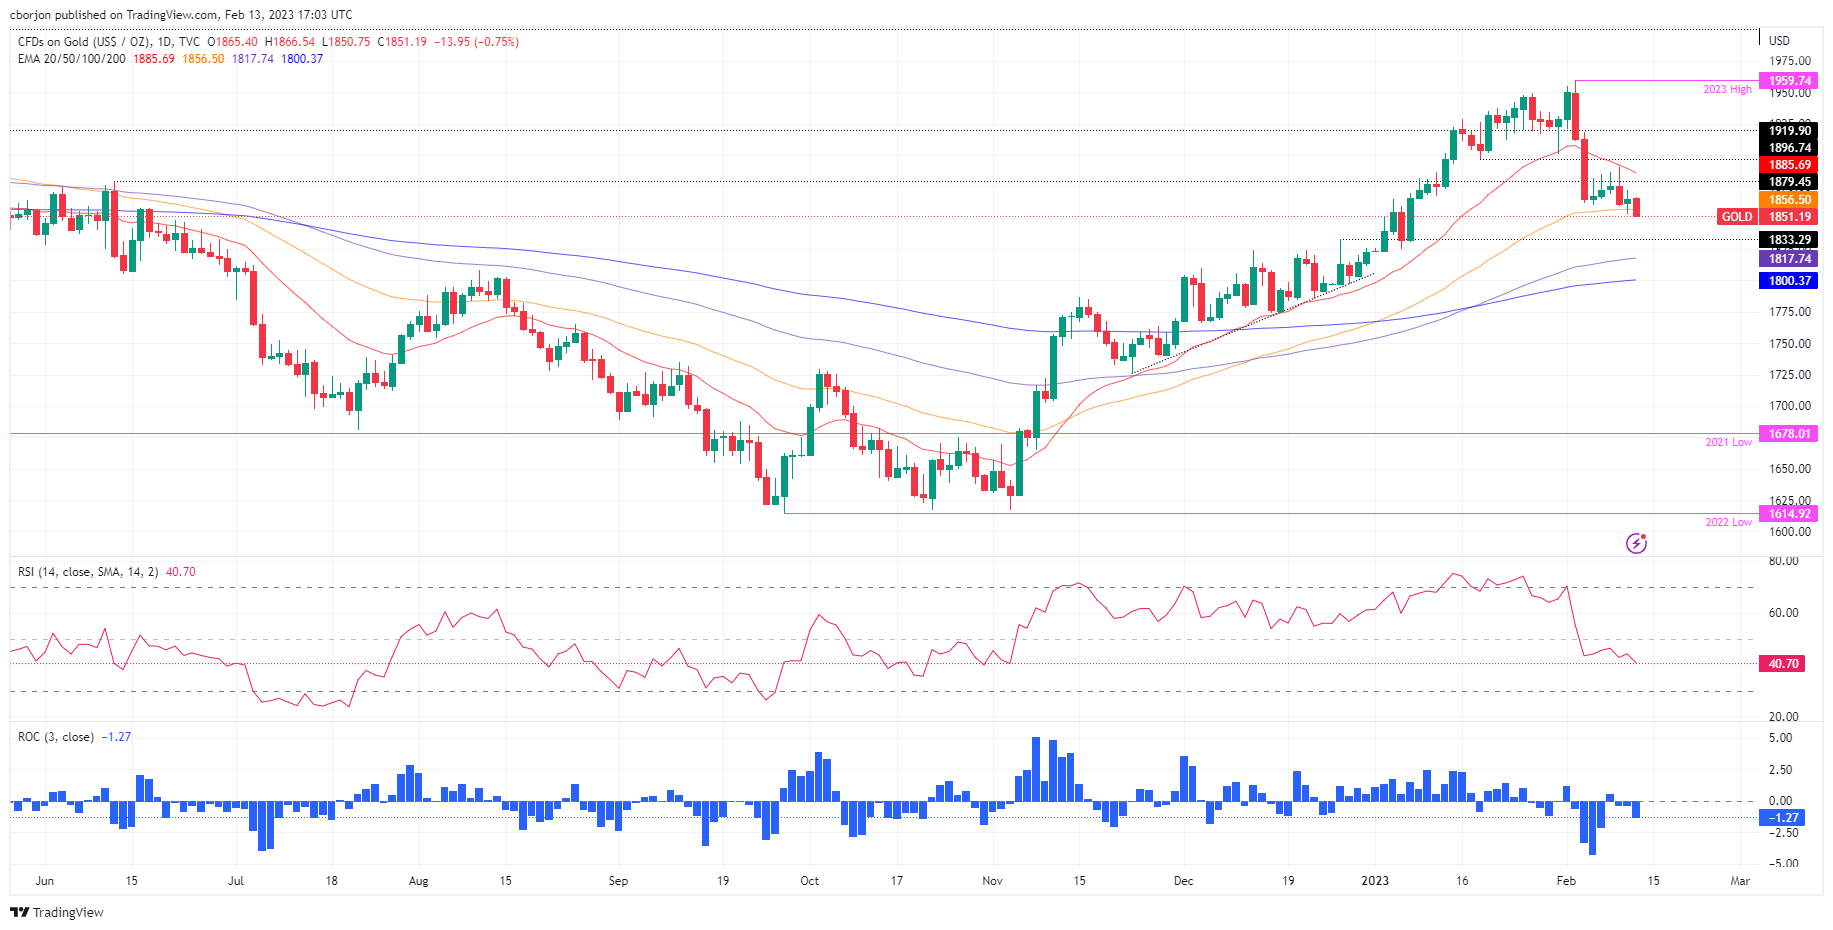
XAU/USD Technical analysis
Technically speaking, XAU/USD remains neutral to slightly downward biased. At the time of typing, the yellow metal falls beneath the 50-day Exponential Moving Average (EMA) At $1856.58, exacerbating further selling pressure. On the downside, the following support levels would be the December 26 daily high of 1833.29 turned support, followed by the 100-day EMA at 1817.77, and the confluence of the 200-day EMA, and the figure at $1800.
(Click on image to enlarge)
More By This Author:
AUD/USD Bounces Off Multi-Day Low, Climbs To 0.6925-30 Region Amid Modest USD Downtick
AUD/USD Reverses Its Course, Edges Towards 0.6910
Silver Price Analysis: XAG/USD Dives Below The 100/200-DMA, Turns Bearish, Eyeing $21.00


Comments
Log in or sign up to join the conversation.