
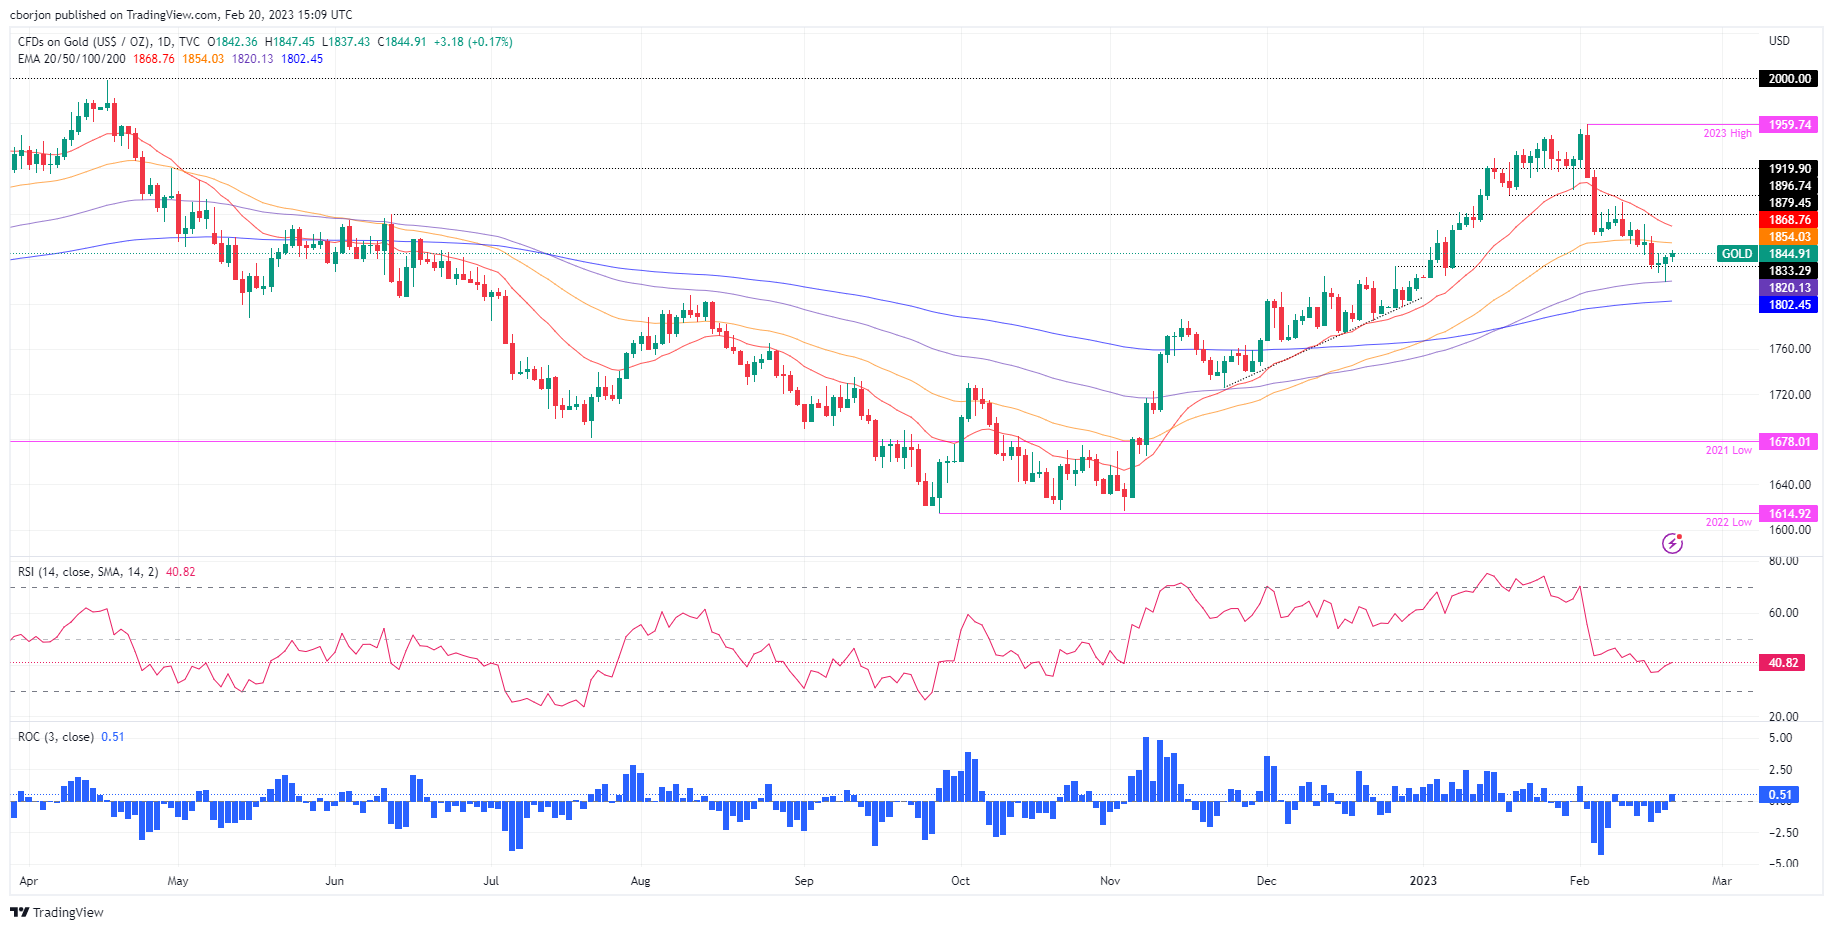
Gold price advances after hitting a six-week low at around $1,819 and aims toward the 50-day Exponential Moving Average (EMA), above its opening price by 0.30%. At the time of writing, the XAU/USD is at $1,845.82, bolstered by a soft US Dollar (USD) undermined by falling US Treasury bond yields.
Gold climbs to the $1,840 mark on a US holiday
As the North American session begins, US equity futures are trading in the red, except for the Dow Jones.
It shouldn't come as a surprise that Monday’s trading session is dull due to thin liquidity conditions, as the US remains on holiday in observance of President’s Day.
Last week’s economic data out of the United States (US) keeps traders nervous, as they begin to price in a more aggressive Fed.
Uncertainty over where the Federal Funds Rate (FFR) will peak triggered the second consecutive week in which US equities finished lower.
In addition, Fed Governor Bowman and Christopher Waller were the latest policymakers to emphasize the need to raise interest rates higher for longer as the US central bank battles to tame inflation.
Last Tuesday, the US economic calendar revealed that the Consumer Price Index (CPI) slowed faster than estimated.
Two days later, prices paid by producers, also known as PPI, came in above estimates and above the prior month's figure, reigniting speculation that the Fed would continue to tighten monetary policy as rate cut speculations begin to fade.
This was reflected in the jump in US Treasury bond yields, which closed theweek at 3.822% - eight basis points (bps) above the previous week, thus also underpinning the Greenback.
The US Dollar Index (DXY), a gauge of the buck’s value vs. a basket of six currencies, climbed above the 104.000 mark. Nevertheless, in Monday's session, the DXY has fallen 0.03% so far, to 103.849.
What to watch?
In the week ahead the US economic docket will feature Existing Home Sales, S&P Global PMI final readings, the core PCE, the Fed's preferred inflation gauge, and the University of Michigan (UoM) Consumer Sentiment.
Gold technical analysis
From a technical perspective, the XAU/USD jumps from the 100-day EMA at $1,820 to above the $1,840 area as buyers prepare to assault the 50-day EMA at $1,854.08.
On the upside, the XAU/USD's first line of resistance is likely to be the 50-day EMA, followed by the 20-day EMA at $1,868.83, ahead of the February 9 daily high at $1,890.21.
Downwards, the XAU/USD's first support level is likely to be the 100-day EMA, followed by the 200-day EMA at $1,802.46, ahead of $1,800.
(Click on image to enlarge)
XAU/USD
More By This Author:
USD/JPY Price Analysis: Bears On The Lookout For A Break To 132.50
EUR/JPY Price Analysis: Subdued Around 143.40, As Bulls Prepare For An Assault To 145.00
USD/CAD Refreshes YTD Peak, Surpasses 1.3500 Amid Siding Oil Prices And Stronger USD


Comments
Log in or sign up to join the conversation.