Gold, Platinum Forecast: Will Supply Shortfall Drive Wider Price Divergence?
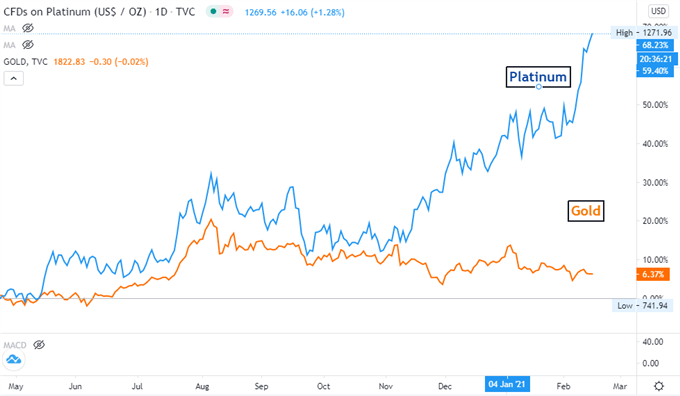
Platinum prices advanced nearly 2% on Monday to hit fresh six-year highs, whereas gold prices traded flat within a bearish-biased trend. Platinum has largely outperformed gold since November 2020, as reflation hopes and a projected recovery in global auto sales brightened the demand outlook for the white metal. Platinum gained over 67% since May 2020, while gold prices rose only 6% during the same period.
Platinum, alongside palladium and rhodium, are used by the auto industry in catalytic converters to reduce harmful emissions, and demand appears to be gaining traction as global auto sales are projected to recover this year. IHS Markit forecasted that global light vehicle sales may increase by 9% in 2021, to 83.4 million, in the wake of recovery from the Covid-19 pandemic. Stricter emission rules and tighter environmental regulations require auto makers to use more platinum as a catalyst, further strengthening its price.
Gold vs. Platinum – May 2020 to Feb 2021
Chart by TradingView
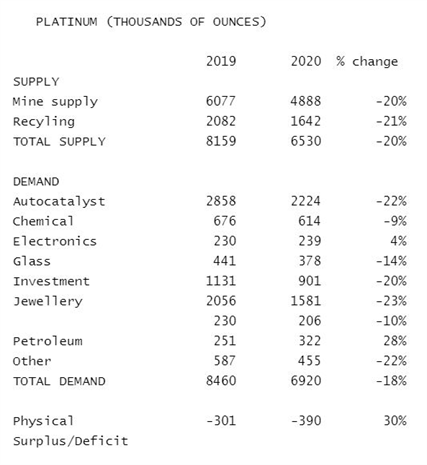
A recent report by autocatalyst manufacturer Johnson Matthey pointed to supply shortfall in platinum in year 2019 and 2020. This led markets to wonder if the shortfall would widen further into 2021 if demand from auto makers rebounds strongly. The physical platinum market saw a shortfall of 390k ounces in supply in 2020, up 30% from a year ago (chart below). Autocatalyst accounts for nearly one third of platinum’s total demand. As such, a strong pick up in auto sales may exert an significant impact to the demand side, encouraging more mining and recycling activity to fill up the deficit.
Demand and supply of platinum in year 2019 and 2020 – Estimated by Johnson Matthey
Source: Reuters
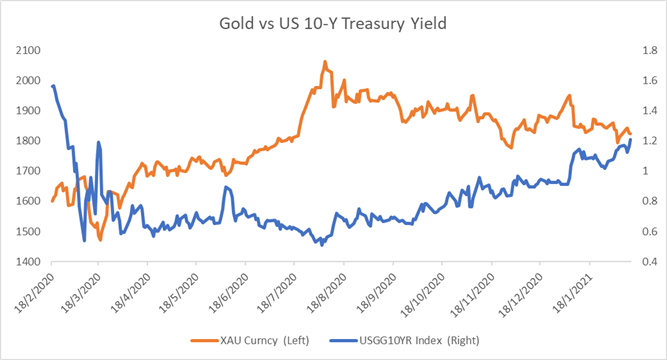
Gold prices, however, remain in a downward trajectory as rising Treasury yields and reflation hopes dampen demand for the yellow metal. US 10-year Treasury yield climbed to an 11-month high of 1.208% on stimulus hopes and prospects of a robust economic recovery. Rising yields and an exuberant stock market rally made the non-yielding yellow metal less appealing as an investment asset. Gold and 10-year yields historically exhibit an inverse relationship, with their past 12-month correlation coefficient standing at -0.22 (chart below).
Gold vs. US 10-Year Treasury Yield – 12 Months
Source: Bloomberg, DailyFX
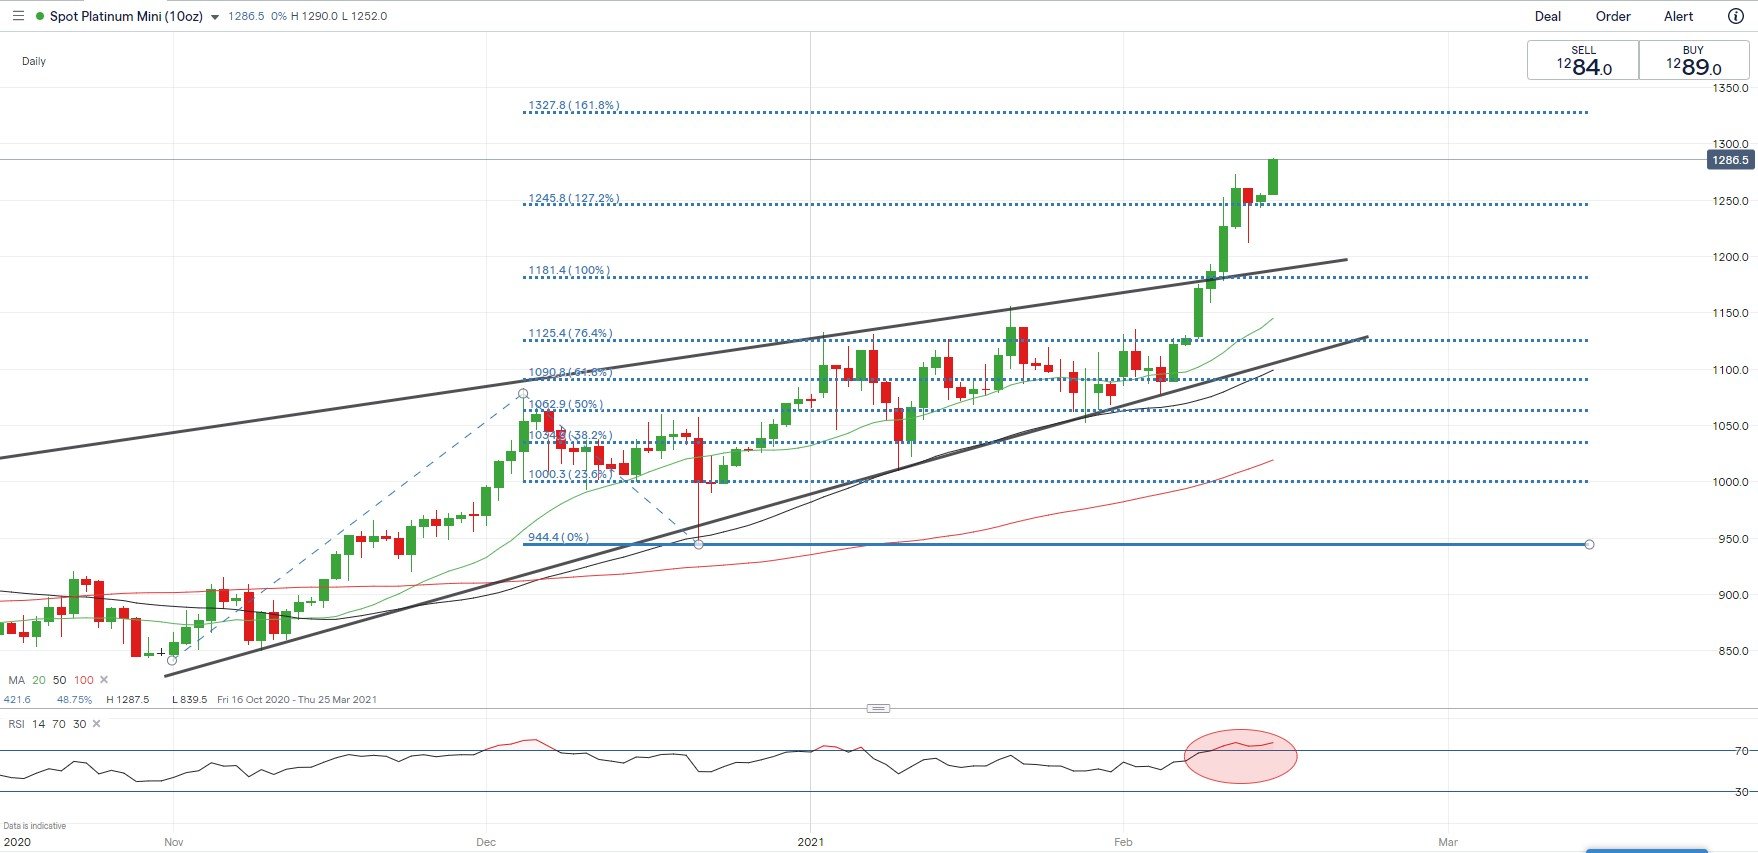
Technically, platinum prices broke above a “rising wedge” and extended higher with strong upward momentum (chart below). Prices pierced through the 127.2% Fibonacci extension level and may have opened room for further upside potential with an eye on US$ 1,327 (161.8% Fibonacci extension). The RSI indicator climbed into overbought territory above 70, suggesting that prices might be vulnerable to a technical pullback.
Platinum Price – Daily Chart
(Click on image to enlarge)

Technically, gold prices extended lower within the “Descending Channel” as highlighted on the chart below. The overall trend remains bearish-biased as suggested by downward-sloped moving average lines. Immediate support and resistance levels can be found at US$ 1,820 (38.2% Fibonacci extension) and US$ 1,840 (23.6% Fibonacci extension) respectively.
Gold Price – Daily Chart
(Click on image to enlarge)

IG Client Sentiment indicates that retail gold traders are leaning heavily towards the long side, with 84% of positions net long, while 16% are net short. Traders have increased both long (+3%) and short positions (+5%) overnight. Compared to a week ago, traders have increased short exposure substantially (+14%) and trimmed long bets (-7%).
Disclosure: See the full disclosure for DailyFX here.


I see the effect of rising long-term Treasury yields as having less and less of an effect on gold = decoupling is underway. Case laid out in my today's analysis again. Platinum, having been under pressure for so many quarters, can go on enjoying its days in the sun. Have a good day!