
Gold and Bitcoin are touted as the “anti-dollar”, or in some people’s minds, possible replacements for the US dollar. Thus, one would expect the dollar-debasement trade to benefit gold and Bitcoin similarly. The reality throughout this year has not been what many would expect. For example, gold is up over 50% this year, while Bitcoin is up about 13% and slightly underperforming the S&P 500.
As we share in the SimpleVisor screenshot below, the excess returns for Bitcoin (IBIT), gold (GLD), and the dollar index relative to the S&P 500 over consecutive periods are not what one would expect. For example, over the last five days, gold has fallen by almost 5% but Bitcoin is up 2%. This same pattern, with one of the two assets up versus the market while the other is down, has held throughout the seven consecutive periods, totaling 245 trading days. We also share the relative performance of the dollar index in the graphic.
If gold and Bitcoin are perceived as the investment of choice in a true dollar debasement, why are they not acting very similarly? This question leads us to an answer we have recently been giving on why gold prices are surging. Our answer is speculation, not fundamentals. While the debasement narrative may seem strong, it has many holes as we have written recently- (Dollar Debasement & Money Supply Growth). Given our fundamental view, we find it highly likely that gold and Bitcoin are not trading in sync because fast money is moving between the two, not into both simultaneously. The divergence in returns suggests to us that speculative trading is playing a role in this year’s outsized gold returns. Be careful trading the narratives!
(Click on image to enlarge)

What To Watch Today
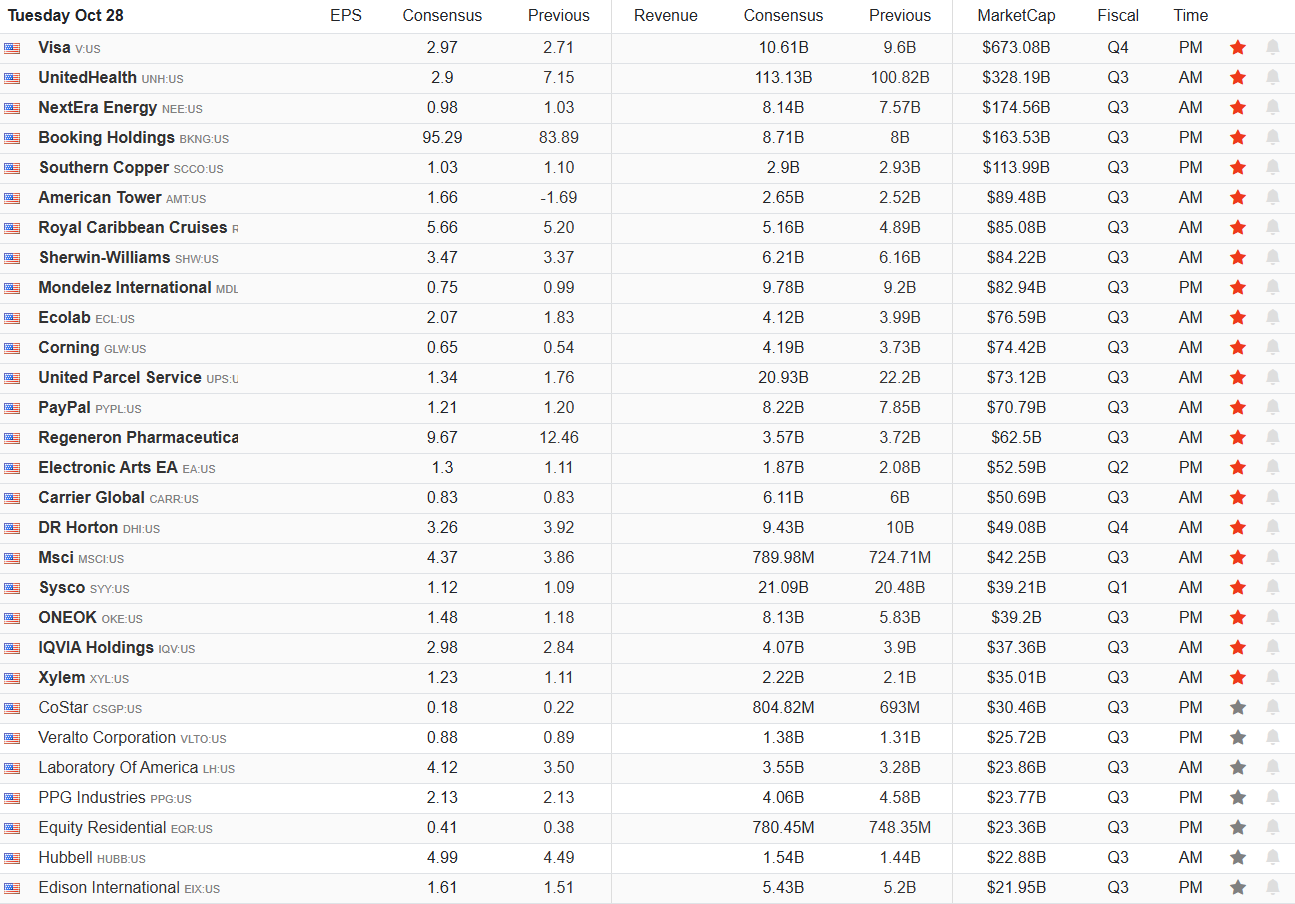
Earnings
(Click on image to enlarge)
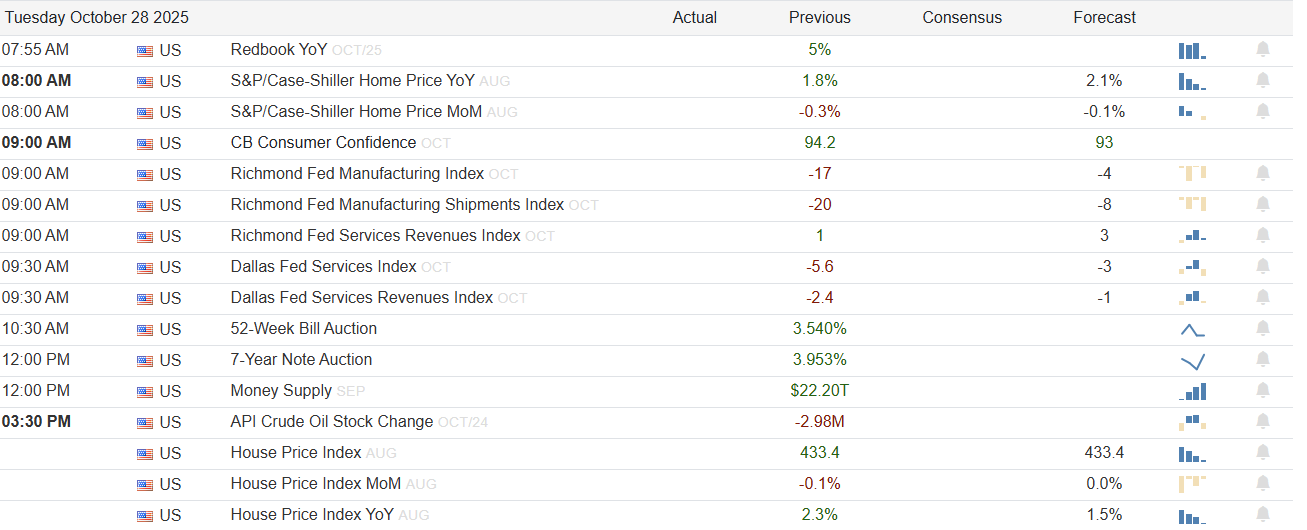
Economy
(Click on image to enlarge)
Market Trading Update
Yesterday, we discussed the market’s technical backdrop, which remains bullishly biased despite the market’s breakout to new highs. That bullish run continues with Megacap stocks leading the charge, hoping for a trade deal with China. Today, we delve into the heart of earnings season, with Visa reporting today, and five Megacap names (Meta, Apple, Microsoft, Google, and Amazon) reporting on Wednesday and Thursday. Also, on Wednesday, we have the FOMC announcement and the next Fed rate cut.
Speaking of earnings, so far, the reports have been impressive.
“Q3 earnings season is, thus far, very impressive in terms of both top- and bottom-line results relative to expectations. 87% of companies have reported earnings that were better than the consensus of Wall Street analysts’ earnings per share estimates. That is MUCH BETTER than the 1-,5-, and 10-year averages of 77, 78, and 75% respectively.” (Data Trek)

Of course, we have many more announcements to go, but so far, and as we noted before, we came into earnings season with largely reduced expectations, leading to a high “beat rate.” To wit:
SPX reporting has broadened out significantly from the financials, yet the beat rate remains quite elevated. The current 84% rate is now down to second-best over the history of our data set, but only just. It’s still the fourth straight quarter of improvement in the beat rate.” – Datatrek.

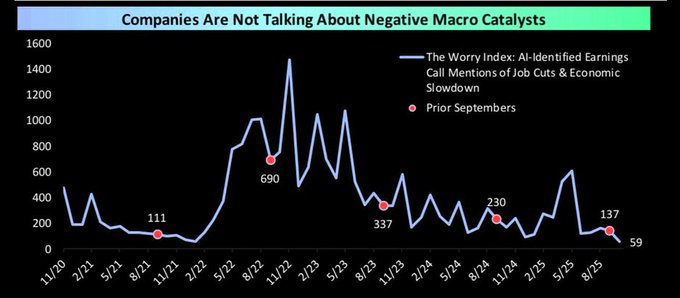
Notably, companies are also largely upbeat on the overall economy, which is providing a bullish backdrop.
So far, companies are avoiding mentions of negative macro-economic headwinds on earnings calls. Which suggests we could see some economic improvement heading into 2026.
As discussed in “Rally Into Year-End,” the earnings backdrop remains one of the three primary market tailwinds into year-end. Share buybacks and professional positioning are the other two. All three of the legs of market support are in place as we kick off November. As we concluded in that article:
“A stock market rally into year-end remains plausible. The path will not be smooth. Elevated valuations and sentiment excess impose risk. But strong earnings, aggressive corporate buybacks, and momentum bias provide real ammunition for continued upside. Seasonal tailwinds align favorably. Tactical discipline and risk management will separate winners from losers. Be ready to buy weakness, protect against extremes, and favor quality. That is how you navigate toward a full‑throttle rally into year-end.”
Trade accordingly.
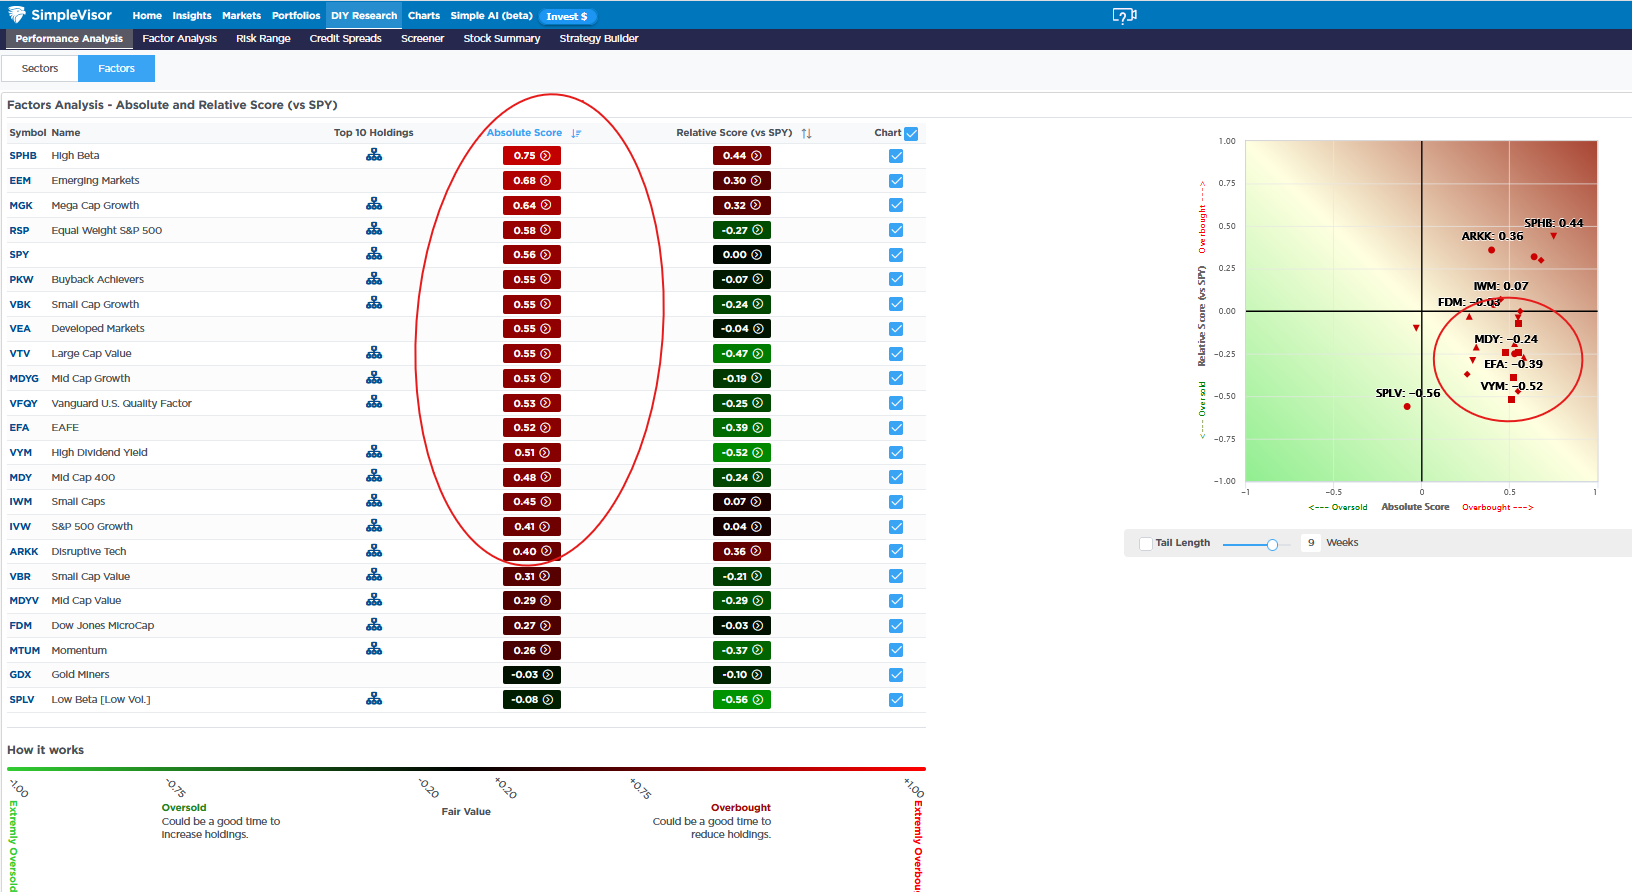
Overbought And Underperforming
Once again, the market is hitting record highs, and its breadth is far from ideal. The SimpleVisor table below shows that on an absolute basis, about three-quarters of the stock factors are decently overbought. However, most are also oversold relative to the S&P 500. Presuming the bullish trend continues, we expect breadth to worsen further, as it has throughout the year.
It’s worth adding that technically, there are negative divergences between the S&P 500 and its MACD and RSI. Bad breadth and negative divergences have been consistently appearing this year. This certainly doesn’t mean the rally is ending, but it does mean we need to keep paying close attention to our risk measures. More simply, it’s not a time to get complacent. Yet at the same time, the situation doesn’t support meaningful risk reduction either.
The Most Dangerous Era In History
We live in what Brett Arends claimed as “The Dumbest Stock Market In History,” but I believe it is potentially the most dangerous era. That phrase is not hyperbole as it reflects structural distortion, extreme valuations, and an investor base intoxicated by momentum and narrative. The MarketWatch piece puts it bluntly: “At one level, there is no doubt that this is the dumbest market in history, because at this point it is completely dominated by ‘passive’ index investing.” That dominance means we are now in the most dangerous era where market mechanics, not fundamentals, rule.
Consider the valuation extremes. The S&P 500 trades at 26 times trailing earnings, and the CAPE ratio hovers near 40x, levels seen only in the height of historic bubbles. The total stock market’s capitalization now exceeds 217% of U.S. GDP, a ratio Warren Buffett once identified as a warning flag. In the MarketWatch narrative: “The market, by this measure, is near the all-time peak reached during the epic bubble around the turn of the millennium.” Those numbers don’t lie.

But as we know, valuations mean very little in the short term during the fevered pitch of an investing mania. However, in the long term, valuations indicate future outcomes. Given the current levels, does it potentially make this era even more dangerous than 2000 or 2007?
Tweet of the Day

More By This Author:
Negative Earnings: Another Speculative FavoriteThe Most Dangerous Era In History
Retail Leverage Goes To Extremes


Comments
Log in or sign up to join the conversation.