
Gold Goes Meme!
This past Wednesday evening, Gold having surpassed the 4200 level, our doorbell rang. ‘Twas unexpectedly a fine friend whose first four words excitedly were: “I just bought Gold!!”
Not wanting to spray a cold spritz on our happy camper — Gold at that point trading better than +300 points above Fair Value, let alone better than +500 points above our BEGOS Market Value — we encouragingly replied: “You do intend to hold it for a long time, yes?” … “Well, sure, I guess,” came the response. “Great,” we said, “you’ll be fine.” For a given time, surely Gold shall further climb … but as we saw yesterday (Friday), hardly in a straight-up line.
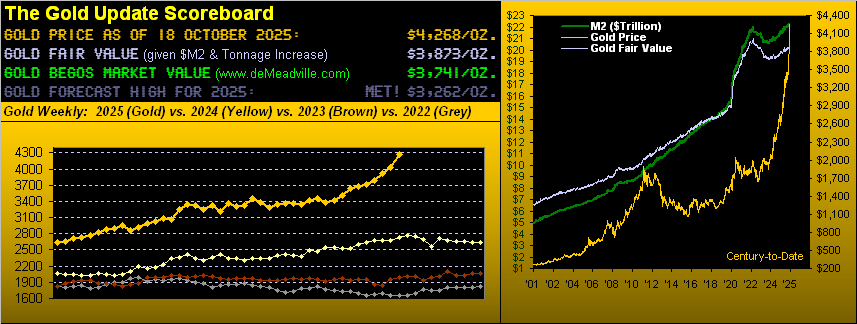
Since said enthusiastic chat, Gold went on to settle the week at 4268, inclusive of All-Time Closing Highs on each of Monday through Thursday, and come Friday, an All-Time Intraday High of 4392.
But then came the El Plungo (technical term): from that intraday high of 4392, Gold plummeted to 4196 in recording the largest intraday loss of -196 points in price’s entire history! By percentage, (for those of you scoring at home), such a -4.5% intraday drop ranks in the 98th percentile, (the worst being a -12.1% intraday drop from 321 to 282 away back on 28 September 1999).
To be sure, we’ve written repeatedly through recent editions of The Gold Update as well as in the daily Prescient Commentary that Gold has excessively exceeded its BEGOS Market Value, and now across the past two weeks as well its Fair Value; (note the enhancements to the above Gold Scoreboard). All that stated, the yellow metal year-to-date is now +61.7%.
Moreover, Silver relative to Gold continues to remain “the better value” in spite of settling at a weekly record closing high of 50.63, en route reaching up to 53.77(!)
‘Course, upon Gold further correcting — which we’re fully expecting — the white metal, too, shall be dragged down. But we still say she’s cheap “relative“ to the yellow metal, given the Gold/Silver ratio is 84.3x vis-à-vis the century-to-date average of 69.4x. Were Silver priced today to that ratio’s average, she’d be a further +21.6% higher at 61.54. Regardless, the white metal thus far for 2025 is now +72.8%. Yes, really.
“But you’re looking for price to revert to the BEGOS value mean, right mmb?”
For Gold, yes, Squire, because it inevitably happens. In appraising Gold vis-à-vis its Market Value (wherein we assess price’s movement relative to those of the five primary BEGOS Markets, namely the Bond, Euro, Gold, Oil, and S&P 500), let’s turn to the following graphic. ‘Tis Gold’s daily closes from one year ago-to-date astride the smooth valuation line to which price always reverts per the oscillator (price less value) in the lower panel. And as depicted, Gold presently at 4268 is +527 points above that value (3741). As the valuation line itself is rising, the midpoint between the two is 4005, albeit pthe rice is subject to falling far faster than does the smooth line rise:
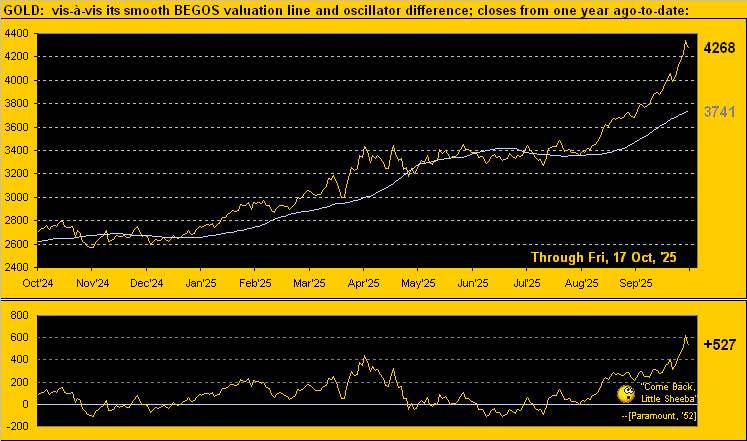
“So mmb, price could actually get back down into the 3000s, eh?”
Certainly, none of us know, Squire. But Gold historically has a hankering to significantly downward correct. Remember Gold’s great gallop from September 2007 into March 2008? ‘Twas a seven-month +52% run to an All-Time High at 1034; but come October of that year, Gold had then floundered -34% to as low as 681. Also, there was the eight-month +44% run during 2011 from February into September, Gold then reaching that infamous All-Time High of 1923 which would then stay in place for nearly nine years through which price suffered a pullback of -45%. And now from just this past April, Gold has gained +48%. To quote the late, great Yogi Berra, is this going to be “Déjà vu all over again”? On verra, mes amis…
Still, in keeping with our title for this week, the Big Deal is Gold’s rather suddenly having morphed from its “nothing more than an old relic, conservative, non-yielding” status into that of the modern-day meme stock. Next month brings the 16th anniversary of The Gold Update. Across most of that stint, under-owned Gold has been otherwise regularly relegated by financial wizards to the ash heap of forgotten obsolescence, even as century-to-date it has vastly outperformed the S&P 500 by 3x. Now, however, that’s all changed. To wit:
The FinMedia today is rife with “highly-intellectual” pieces underscoring the same Gold-ownership rationale of which we’ve been writing for the past 16 years. As herein penned two missives ago: “…it suddenly seems that everyone’s become a Gold expert…” Honestly, are they just figuring all this out now? Where have they been? In recent weeks, we’ve been inundated by friends and acquaintances telling us all about Gold. Gold has gone meme, just as did GameStop, AM,C and Bed Bath and Beyond as pushed by the “Let’s all buy high!” crowd. We hope that — unlike those memes — Gold doesn’t follow suit and crash. Nor do we think ’twill. But reversion to the mean (not meme) is in order, as unlike those stocks that were meme’d, Gold shan’t get creamed.
“Still, mmb, price has gone up for nine weeks in-a-row…”
Squire, on a mutually-exclusive basis that has occurred but three other times so far this century, the longest such stint being 12 consecutively higher weeks during the aforementioned uptrend which began in 2007. And Friday’s record-setting intraday points-drop may signify that the top is in place at least for the near-term. Regardless, as we go to Gold’s weekly bars from a year ago-to-date, this past week’s low (4011) is an extreme +5.5% above the dashed linear regression trendline (3804), such deviation century-to-date being nearly off the end of the Bell Curve (in the 93rd percentile):
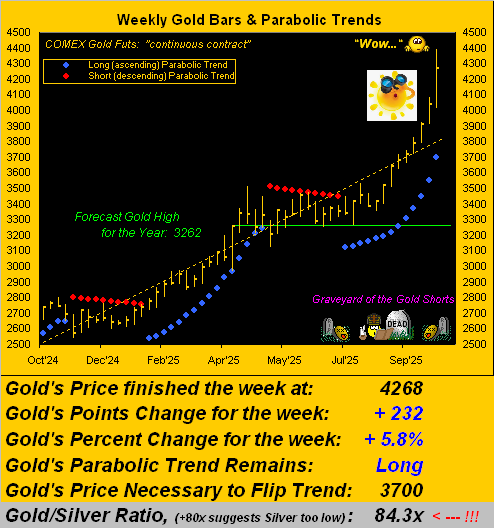
With respect to Gold potentially correcting at least over the near-term, the above graphic’s graveyard regardless reminds us that “Shorting Gold is a bad idea.” Still, let’s next assess the daily bars for the precious metals from three months ago-to-date, featuring Gold on the left and Silver on the right. In both cases, the baby blue dots of linear regression trend consistency have been housed above the key +80% axis for nearly six weeks, a firm indication of their sustained uptrends. However, as regular readers and website visitors know, upon the “Baby Blues” sinking below that level, lower prices likely are on the way. And with both metals closing well off their rightmost Friday highs, again a near-term top may be in place:
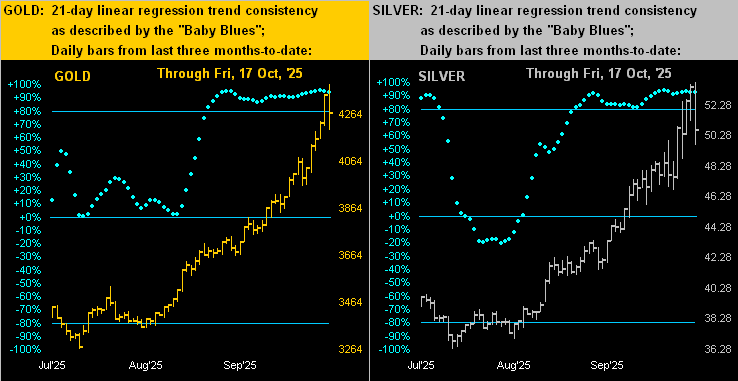
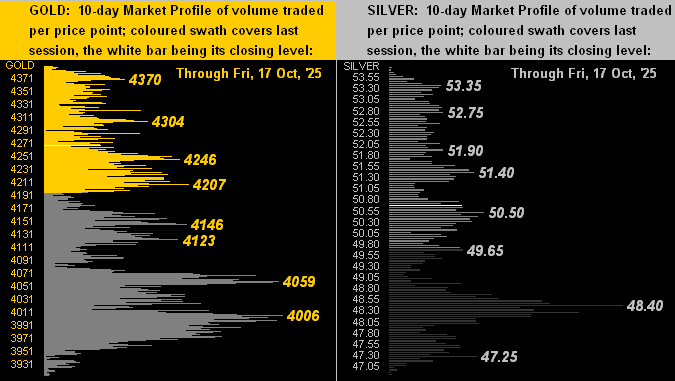
Too, by their respective 10-day Market Profiles for both Gold (below left) and Silver (below right), we can see the demise from Friday’s highs. By the labeled volume-dominant prices, Gold would appear to have a bit more underlying support than does Silver. ‘Tis not that rare a condition, especially should Silver couple up with Cousin Copper, whose own “Baby Blues” just confirmed a break below the +80% axis, (which you can view on the website). Thus shall Sweet Sister Silver discard for a time her precious metal pinstripes in exchange for her industrial metal jacket? She does on occasion stray that way… Here are the Profiles:
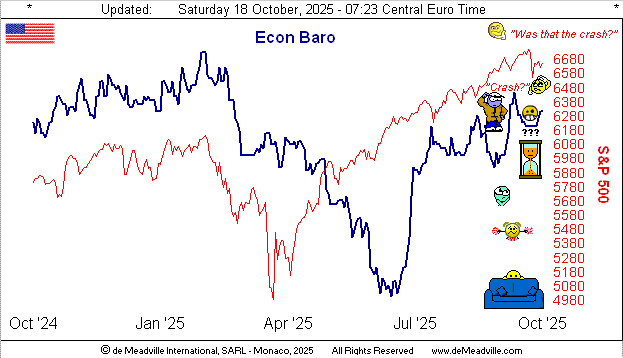
Unable to materially stray — due to the “shutdown” of the StateSide government — has been the Economic Barometer. From 01 October-to-date, there’ve been 32 scheduled metrics for the Baro … of which just nine have made the trip. Four so did this past week, amongst which three bettered their prior period: October’s New York State Empire and National Association of Homebuilders Indices, along with September’s Treasury Budget. The week’s sole loser was the Philly Fed Index for October. As for the 23 “missing links”, it remains to be seen (should the government ever reconvene) how they’ll affect the Baro’s scene. Until such time passes, here ’tis as is:
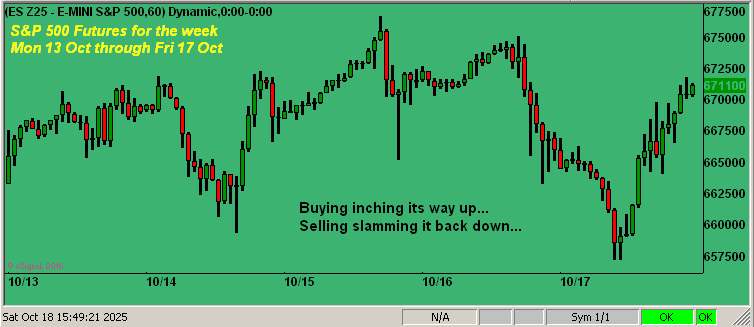
Toward wrapping, just a brief word on the S&P 500. ‘Tis Q3 Earnings Season, which so far (whilst still very early) is running well: 79% of the 39 reported constituents have beaten their Q3 of a year ago. Problematic is that the overall level of earnings remains unsupportive of the Index’s level (6664) given the honestly calculated price/earnings ratio (48.9x, the formula for which we’ve herein posted on numerous occasions). And per this next graphic of the past week’s S&P 500 Futures by the hour, the “inching-up buying” is being repetitively met with “slamming-down selling”. Thus, such word to you WestPalmBeachers down there we hope is sufficient:
We close with this hilarious headline of the week, courtesy of The Edge, Malaysia: “Bitcoin, Binance-Linked Coin Struggle After Historic Wipeout”. In perusing the piece, ‘twould seem that corrections of 3%-to-20% are now deemed as “wipeouts”. ‘Twill be (dare we say) edge-of-the-seat stuff to read just how a 30% correction might be so characterized. Just sayin’… “Oh steady on there, lad!”
A pending correction or otherwise for meme-like Gold, one may buy that sold for more to hold!
More By This Author:
Silver’s New-Found Sky; Gold’s Gut-Punch From High; S&P’s GoodbyeGold Achieves Fair Value
Gold Furthers Record Ticks; Silver Snags 46!


