

Image Source: Pixabay

On the heels of last week's piece which pointed to gold as a "bargain," gold-getters have since come to the fore to push the price as high as 1864 before settling on Friday at 1863. That doesn't mean gold has concluded testing our 1851-1798 support zone that we've often mentioned. But it is gold's upside volume pace which we now embrace.
After flirting with the 1851 level beginning on Feb. 15, gold slipped underneath without looking back, instead bottoming at 1811 this past Tuesday, Feb. 28. Across those trading minutes, gold's downside pace averaged about 108 contracts per minute. However, in the swift race to regain the 1851 level the very next trading day on Wednesday, March 1, gold's upside pace averaged about 135 contracts per minute.
Thus, gold's upside volume pace improved on the downside pace by +26%. How many times have we stated that -- unlike other markets -- gold tends to rise faster than it falls. And the gold-getters "get it."

This reveals, at least at present, that there is more interest in buying gold than in selling it, even as the Federal Reserve looks to further the ascent of its interest rates. Even so, the dollar is showing the earliest technical signs of at least some mild retrenchment, which should further buoy gold. Of course, with so much market uncertainty these days, it can all turn on a dime.
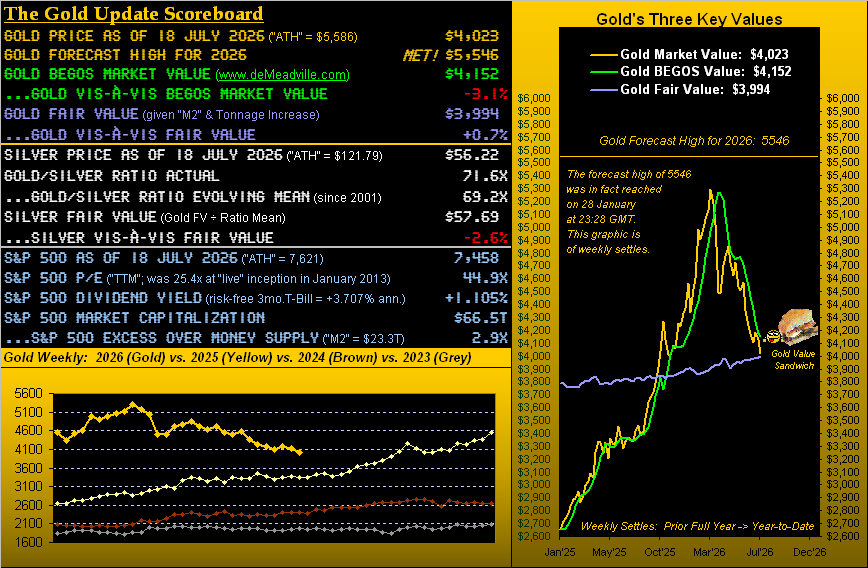
So, let's digest gold's weekly bars from one year ago-to-date. Does this recent dip into support and subsequent recovery suggest the current parabolic trend is short-lived? After all, it has only endured over the course of three weeks so far, whereas the average length of the past 10 short trends is approximately 13 weeks.
However, that doesn't preclude there not having been a few brief short-term trends: four of the past 14 trends have lasted about five weeks or less. With Friday's price being some 96 points below the "flip to long" price (1959) and gold's "expected weekly trading range" now being 52 points, two robust up weeks from here could end the short-term trend, with the 2000s then being in the offing.
Yes, visually, this does appear like a bit of a stretch. But the green support zone in the graph has been doing its job, as gold, from its intraweek low to a settled range, has sported its eighth-best gain in a year.

Moreover, with respect to the Fed, Governor Christopher Waller suggested this past week that the Bank's rate hikes are not keeping pace with inflation, and that the job market is "unsustainably hot." One might even say that the whole economy looks "hot" as of late.

And the standout star for the past week was January's Pending Home Sales rocketing up +8.1%, a 17-month best. Is America thus "on the move," or is it cashing in so as not to lose?
In less of a starring role, however, is the S&P 500, for which Q4 earnings season just concluded. Of the Index's 503 constituents, 471 reported within the seasonal timeframe, 60% of which improved their bottom lines over Q4 of a year ago -- therefore, the other 40% did not do so. But let's drill a bit deeper.
451 did have positive earnings (regardless of whether or not they improved), which, combined on a cap-weighted basis, resulted in an overall earnings season gain of +2.7%. The Consumer Price Index year-over-year gained +6.0%. The yield on the S&P itself gained 1.698%. The U.S. 3-month T-bill gained 4.718%.
Are you thinking that the stock market's way too high? The "live" price/earnings ratio for the S&P settled recently at 42.5x, nearly double the historical average to which the P/E always reverts. And gold, at 1863, is at half of its dollar debasement valuation.
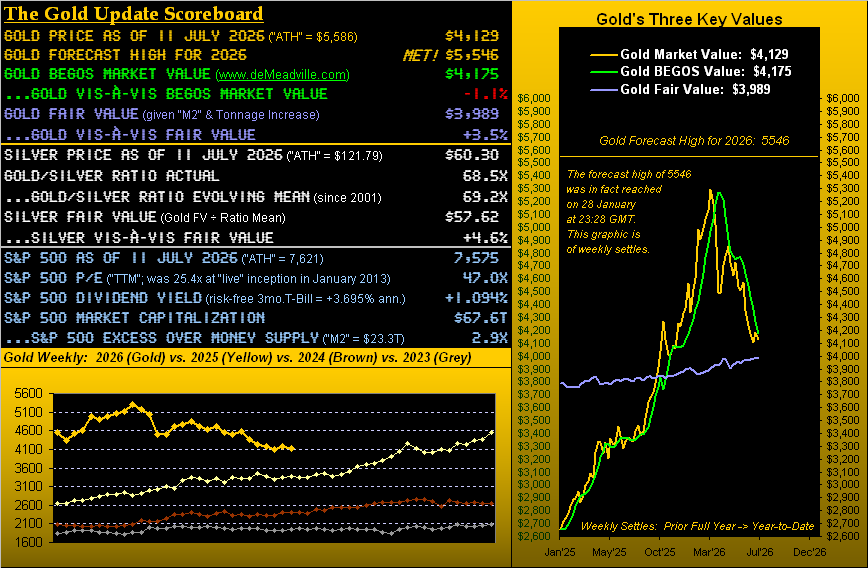
Meanwhile, from the "what a difference a week makes" department, we turn to gold's two-panel graph of the daily bars from three months ago-to-date on the left, and the 10-day market profile on the right. The blue dots which display trend consistency are turning the corner, suggesting that the downtrend has reached its bend, Meanwhile, on the right, price has gone from worst to first, as shown by the white speck at the top.

Having improved as well, despite its struggle, is silver. On the left, the blue dots lack the more robust up-curl of those seen with gold. And on the right, silver's price has only ascended halfway up through the market profile, with the gold/silver ratio remaining excessively high at 87.1x.

Regardless, it was a fairly robust week for gold, with silver somewhat coming along for the ride. It is an added plus that this past week's up volume pace exceeded that of the down volume through gold's testing of the support zone. And should gold eclipse the mid-1870s in the new week, 1900 may also lie in range.
More By This Author:
Bargain Gold Dives Deeper Into SupportGold Trips The Parabolic Flip And Tumbles Into The Support Strip
Gold Still In Stall, Looks Further To Fall
Comments
Log in or sign up to join the conversation.