
Gold Furthers Fall As Called
Through the 44 trading weeks thus far for 2025, Gold therein has recorded a net weekly gain 31 times (70%). Further, for the year’s 13 net losing weeks, never have there been three in-a-row. However, for just the fifth time this year, Gold has again recorded back-to-back down weeks. Shall that extend to three? Let’s see.
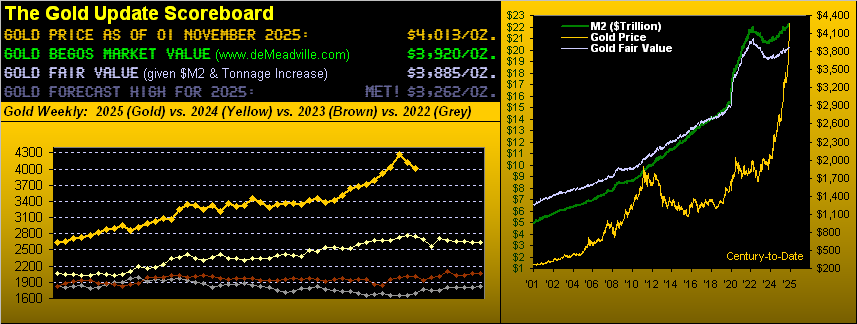
Gold settled this past week yesterday (Friday) at 4013. Albeit a down week, ’twas a fourth consecutive weekly close above the 4000 milestone level. Yet en route, price furthered its fall to the first of three “fib-based” retracement levels herein called a week ago. Indeed last Tuesday at 04:24 GMT, Gold traded down to the first level of 3985, continuing that day lower still to 3901, a “scant” 44 points above the second noted level of 3857, (the third being 3729). We say “scant” given Gold’s “expected daily trading range” is now 128 points; at the turn of this century, it took nearly three years to initially move higher by that many points; now such range is “expected” in just one day.
“But for those two other levels, mmb, are you saying they can’t be reached ’cause price won’t go down for a third straight week?”
Dear Squire, price certainly can go on multi-week bearish runs. Recall during 2016 for the seven weeks ending 11 November through 23 December, Gold recorded net losses for all of them, preceded by a similar seven-week down stint during summer of 2015. Moreover, the last time Gold posted only three consecutive down weeks was almost exactly one year ago (those in 2024 ending 25 October through 15 November) … just in case you’re scoring at home. And (pun intended), Gold weakly finished this past week — yes, able to regain 4000 — but ’twas the lowest weekly settle of the past four.
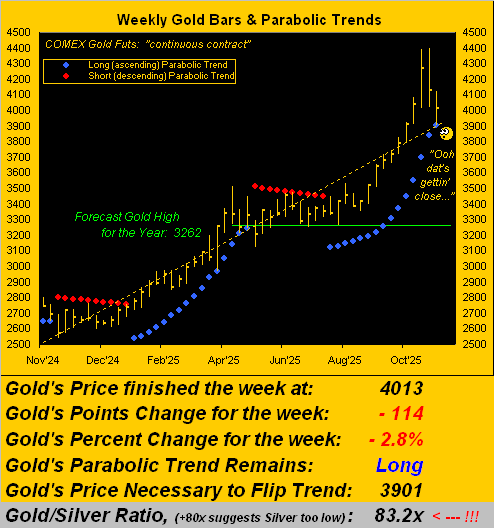
In the midst of it all, Gold’s weekly parabolic Long trend — again by Tuesday’s 3901 low — was within a day’s range of flipping to Short. And now for the ensuing week, 3901 becomes that flip-to-Short level as stated in our graphic of Gold’s weekly bars from a year ago-to-date:
“Unless Gold moves higher, right mmb?”
Squire, Gold’s near-term technicals — having been so thoroughly upside strong of late — are now showing signs they’re running out of puff. To be sure, an intraweek drop from here at 4013 down to 3901 would be a skid of -112 points; however, Gold’s “expected weekly trading range” is now 172 points such that a third consecutive down week could well flip the trend to Short. But again, year-to-date, Gold has yet to record three successive down weeks, (not that ’tis a trend upon which we’d depend…)
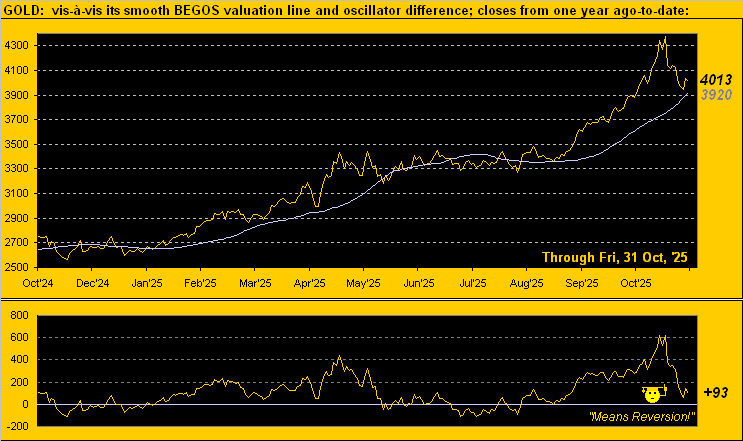
As well, Gold by its BEGOS Market Value (derived by Gold’s movement relative to all five primary BEGOS components, namely the Bond, Euro, Gold, Oil & S&P 500) is now only +93 points above its smooth valuation line. Recall just two weeks ago Gold being better than +600 points above same and our cautioning that price inevitably reverts to the mean, (in this case the Market Value line which presently is 3920). Notice the exquisite timing of means reversion being coincident with everyone recently having become a Gold expert. Liquid markets are a beautiful thing:
Truly beautiful, too, is the year’s ongoing leadership of our Metals Triumvirate in the BEGOS Market Standings, still pristinely led by Sweet Sister Silver. With ten months now in the books, here’s how it all looks:
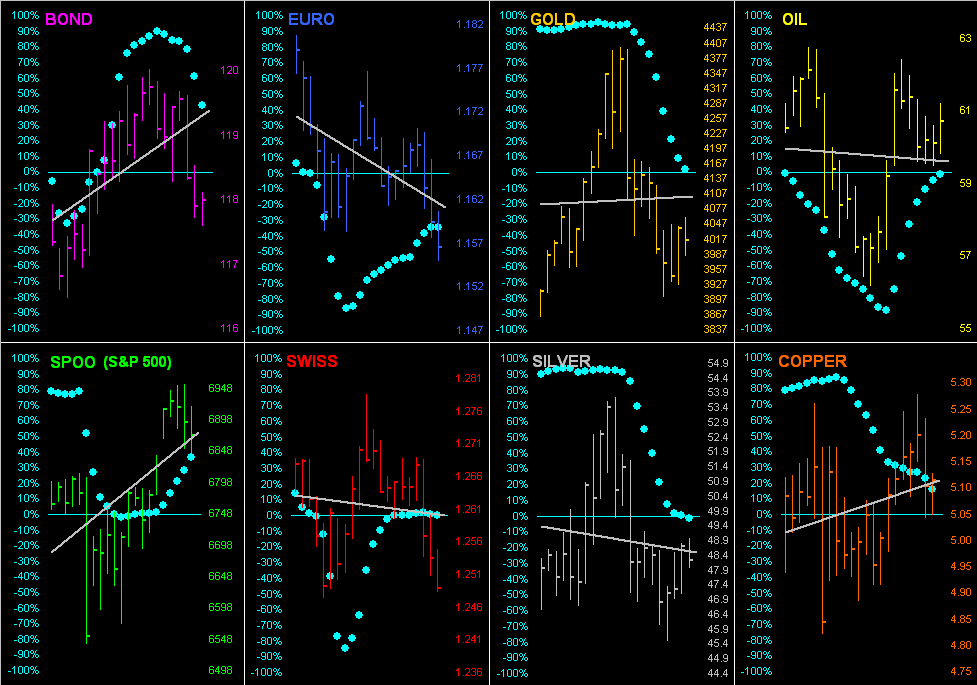
As to their travel from a month ago-to-date, here are those markets’ respective daily bars, grey regression trendlines, and beloved “Baby Blues”, the dots indicative of each trendline’s consistency. Of import (if given little FinMedia notice): the Dollar Index has risen five of the past seven weeks. Thus, we’ve the negative trendlines for both the Euro and Swiss Franc … and now for Sister Silver, too. Note that Gold’s trendline has all but rotated to negative, the “Baby Blues” in full cascade. Time to get a grip … else further dip!
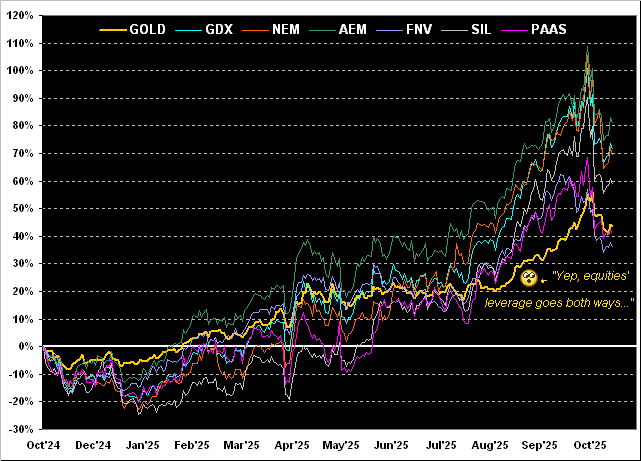
Amplifying the precious metals having pulled back from the highs of two weeks ago are the associated equities. Gold’s All-Time Closing High back on 20 October at 4374 has since fallen -8.3% to the current 4013 level. However, every equity product in the following graphic has exceeded that pace of pullback, ranging from -9.0% to -14.7%. As we on occasion quip: “Live by the leverage, die by the leverage”. Clearly, the amplitude of the chart’s Gold line is mild vis-à-vis those of the equities. Regardless, year-over-over the overall performances remain remarkable. Therein, Franco-Nevada (FNV) is +36%, Pan American Silver (PAAS) +41%, Gold itself +43%, the Global X Silver Miners exchange-traded fund (SIL) +59%, Newmont (NEM) +69%, the VanEck Vectors Gold Miners exchange-traded fund (GDX) +71%, and Agnico Eagle Mines (AEM) +81%:
Turning to the 10-day Market Profiles, both precious metals seemingly are positioned in and around their most volume-dominate prices of the past two weeks. For the yellow metal on the left, the denoted 4123-4022 area appears pivotable, whilst for the white metal on the right ’tis her 48.60-47.75 zone:

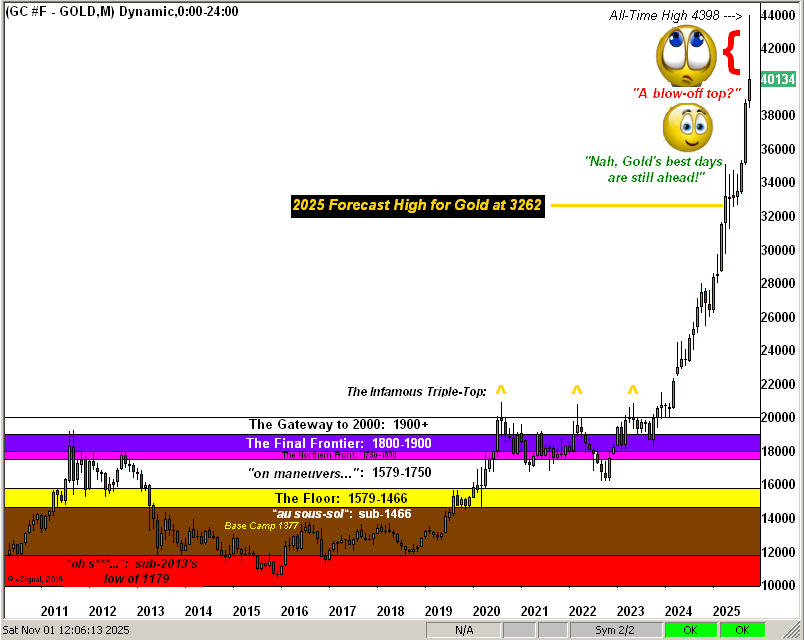
‘Course it being month-end, we’ve next the Gold Structure graphic of price’s monthly bars from the year 2010-to-date. The lower areas of the chart still display the many stratified price areas through which we arduously struggled with Gold until finally, just two years ago, “The Infamous Triple Top” was broken, Gold having then been off to the races ever since. The third of those three tops was 2085 on 04 May 2023, from which to the present All-Time High of 4398 is a gain of +111% in just 2 1/2 years. As doubtless (barring a deflationary depression) Gold never again shall trade sub-2000, we’re “considering” future versions of this graphic to not extend back past the year 2020. Still, those older areas are an amazing reminder of what was endured and then how far we’ve come. As for “The Now”, the rightmost red-braced “failure candle” (October) is exemplary of what happens when — again — suddenly everyone’s a Gold expert, (which for you WestPalmBeachers suggests “The top is in!” … but more broadly, we doubt it):
One can only wonder if StateSide “the top is in” for the economy as there is little data upon which to go. On Wednesday, the Federal Open Market Committee voted (not unanimously) to lower its Bank’s Funds Rate -25bp to the 3.75%-4.00% target range, even as the Policy Statement opened with “Available indicators suggest that economic activity has been expanding at a moderate pace.” Available, indeed: given the “shutdown”, only 15 of the 49 metrics due for the Economic Barometer during October arrived. And of those 15, just six improved period-over-period. There’s your “moderate pace”, baby. Too, there’s the S&P 500: is “the top in” there? Note our table in the Econ Baro of those constituents priced (given almost no earnings) beyond all sensibility. Better queried: “Have we crashed yet??” Here’s the Baro:
To wrap this week, regular readers of The Gold Update know we (as just done) “rib” those “WestPalmBeachers down there”, the claim-to-fame of south Florida’s brightest bulbs being “Hanging Chad” back in 2000 during “W vs. Algore”.
Technically, Florida is one of 50 states comprising the federal union of the U.S. Fundamentally however, Florida is more of a foreign country unto itself. Its pencil-thin panhandle barely clings to the southernmost coastline of Alabama and Georgia. The distance from Miami to Havana, Cuba is just 70% the distance to Jacksonville. And ’tis written the State’s average elevation is 100 feet (30m). Florida is FLAT, man. (In ’64, we visited an auntie there, and given the lack of depth perception, once was enough).
But to the point (hat-tip A.C.): assuming ratification by the state’s legislature, eight months from this day on 01 July 2026, Florida shall officially acknowledge both Gold and Silver as legal tender in coin form, and without sales tax on purchases thereof. To quote Grace Slick with The Jefferson Airplane at Woodstock back in ’69: “It’s the new dawn!”
So for Florida, with Gold and Silver, let fiat be gone!
More By This Author:
Gold Meme’d Gets Bean’d!Gold Goes Meme!
Silver’s New-Found Sky; Gold’s Gut-Punch From High; S&P’s Goodbye


