
Gold Forecast: Set To Break 9-Week Winning Streak Ahead Of US CPI
- Gold witnessed a significant pullback as the dollar strengthened amid the global developments.
- In the long run, gold maintains its uptrend amid persistent geopolitical uncertainty and central bank purchases.
- Traders await the key US CPI releases for further policy cues.
The gold forecast remains mildly subdued after witnessing a sharp retreat, trading around the $4,060 level amid global geopolitical developments.
The yellow metal is set to break its nine-week winning streak, caused by broader greenback strength and rising Treasury yields. Earlier this week, the asset climbed to record high near $4,380. The expectation of Fed easing is a key catalyst for gold, with markets expecting two more 25-bps cuts before year-end. If the US CPI reading comes in strong at 3.1% YoY, it could strengthen the yields and dollar together, pressuring gold further.
The markets maintain a cautious sentiment in the US as traders await the US CPI data and brace for a possible delay in the Fed rate cuts. A stable dollar is likely to weigh on gold in the near term. However, if the inflation data is softer, tit will revive Fed easing expectations supporting the metal.
Meanwhile, the Reserve Bank of India now holds 880 tonnes of gold. This move trims US Treasury exposure to help diversify resources amid lingering economic concerns. On the other hand, the global central banks increased gold by 15 tonnes in August, reflecting the official demand for gold.
Additionally, the upcoming US-China trade talks in Malaysia and the persistent geopolitical risks, such as US sanctions on Russia to pressure Moscow for a ceasefire with Ukraine, and the Central Banks’ purchases support gold’s safe-haven appeal and maintain its medium-term uptrend.
Gold Daily Key Events
The significant events in the day include
- Core US CPI m/m
- US CPI m/m
- US CPI y/y
- Revised UoM Consumer Sentiment
- Revised UoM Inflation Sentiment
On Thursday, traders look forward to the US inflation and consumer sentiment for further insights into the monetary policy expectations.
Gold Technical Forecast: Broken 50-MA to Ignite Losses
(Click on image to enlarge)
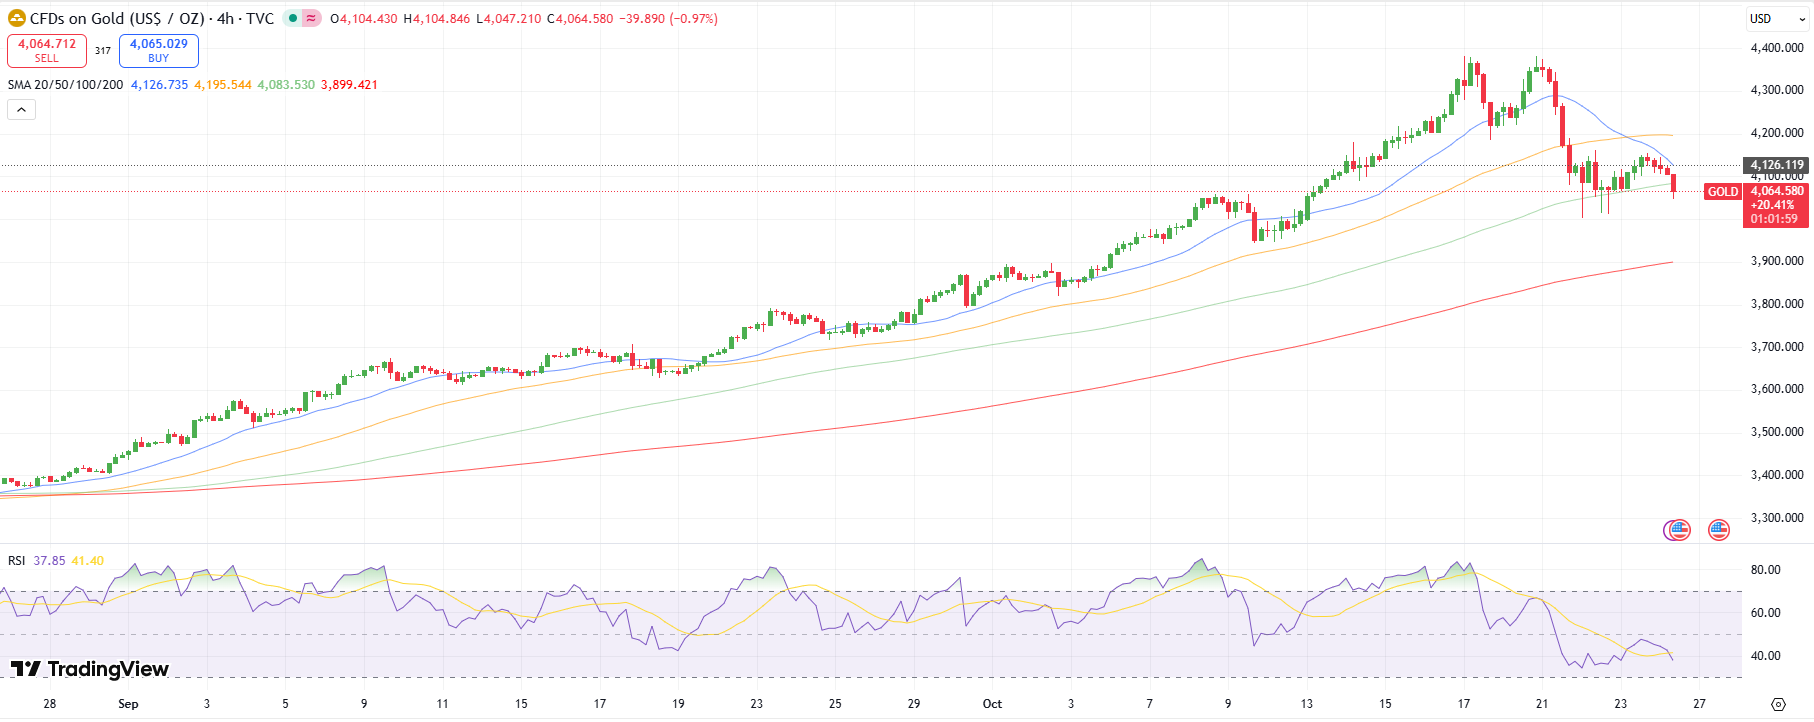
Gold 4-hour chart
Gold’s 4-hour chart signals a significant retreat from all-time highs around the $4,380 level. The price consolidates below the 100-period MA around $4,085, suggesting a subdued bullish bias. However, the price remains above the 200-SMA around the $3,890 level, which could provide respite to the buyers.
The RSI is at 41, suggesting softer buying momentum. A decisive drop below the $4,080 level could trigger a selling phase around the $4,000 and $3,890 levels. A breach above the $4,150 level could extend gains towards the $4,200 and $4,270 levels.
Support Levels
- $4,085 (100-SMA)
- $4,000 (psychological support)
- $3,890 (200-SMA)
Resistance Levels
- $4,100 (round number)
- $4,160 (recent swing high)
- $4,200 (psychological resistance)
More By This Author:
GBP/USD Forecast: Pound Digesting Weak Inflation, Greenback Up
EUR/USD Outlook: Consolidating Under 1.16 Amid Mixed EU-US Signals
EUR/USD Forecast: Sellers Dominate Under 1.16, Eyes On Lagarde’s Speech
Disclaimer: Foreign exchange (Forex) trading carries a high level of risk and may not be suitable for all investors. The risk grows as the leverage is higher. Investment objectives, risk ...
more

