
Gold Commodity - Elliott Wave Technical Forecast
Gold Market Overview
Gold remains in a long-term bullish cycle, with past 2–3-year pullbacks consistently offering renewed buying opportunities. The latest decline from April 2025’s high is expected to follow the same pattern, creating potential for another upward move.
Daily Chart – Bullish Cycle Progression
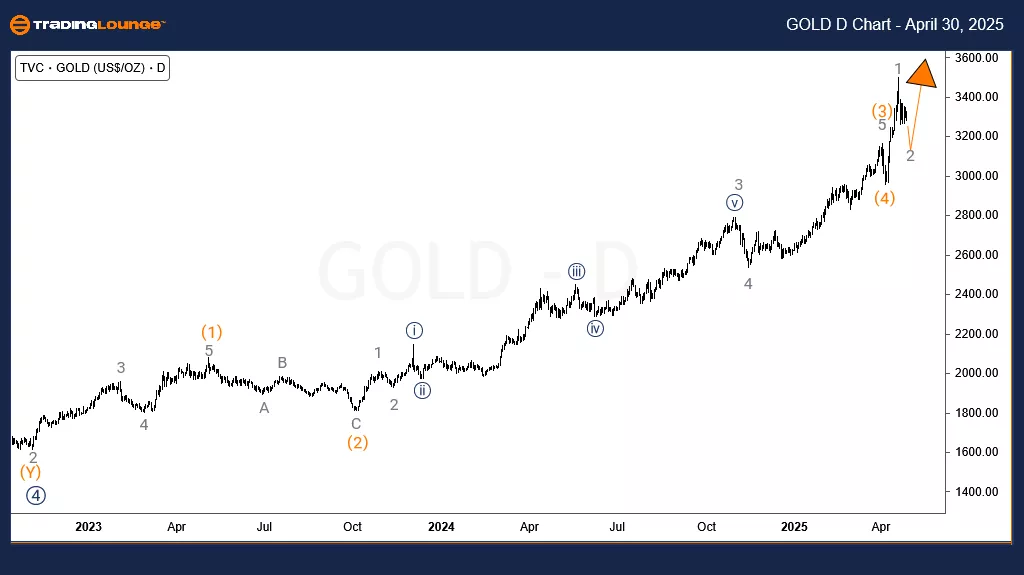
Wave ((4)) of cycle degree completed in October 2022, initiating the current bullish run in wave ((5)).
This wave ((5)) marks the final segment of wave I of (III) — the broader uptrend from December 2015.
Within wave ((5)), wave (3) ended on April 2, and wave (4) concluded on April 7.
From the April 7 low, wave (5) began, completing wave 1 of (5) in an impulsive form.
The current decline reflects wave 2 of (5). As long as the price remains above the invalidation level of 2956, the uptrend remains intact.
4-Hour Chart – Corrective Structure in Focus
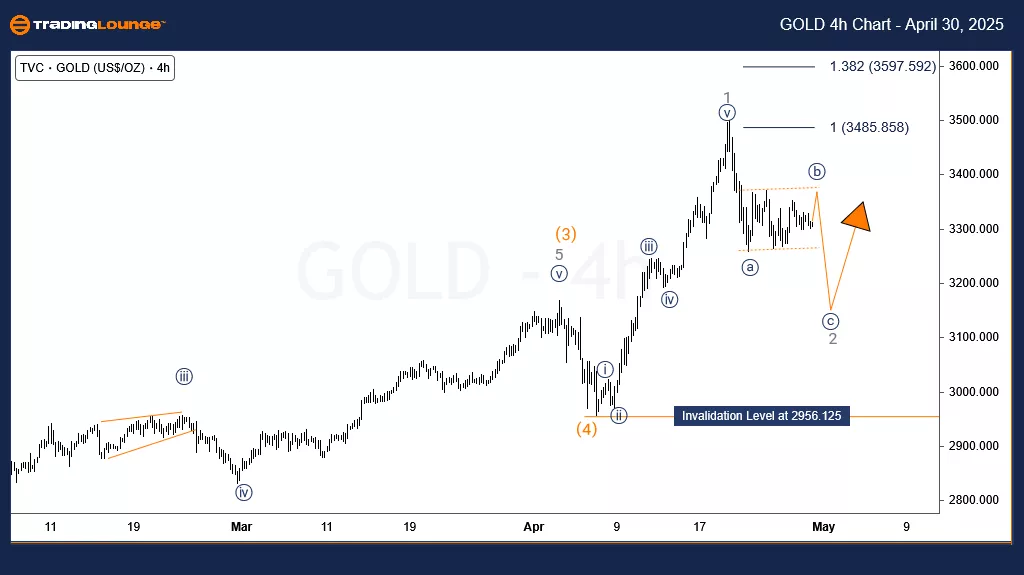
The 4H chart displays a sideways pattern following a 5-wave decline from the recent high.
If the April 7 low is broken, wave 2 could extend to the 3127–3034 zone, which may present renewed buying pressure.
A successful bounce could launch wave 3 of (5), with upside targets reaching 3700 and beyond.
Conclusion:
Gold’s current pullback fits within the structure of a bullish trend. If support zones hold and wave 2 completes soon, traders can look for signs of a breakout into wave 3 of (5), targeting new highs.
Technical Analyst : Sanmi Adeagbo
More By This Author:
Unlocking ASX Trading Success: Car Group Limited - Wednesday, April 30
Elliott Wave Technical Analysis: MicroStrategy Inc. - Wednesday, April 30
Elliott Wave Technical Analysis: U.S. Dollar/Japanese Yen - Wednesday, April 30
At TradingLounge™, we provide actionable Elliott Wave analysis across over 200 markets. Access live chat rooms, advanced AI & algorithmic charting tools, and curated trade ...
more

