
Gold Charts An Array Of Buy Signals
For the past two weeks, US interest rates have rocketed higher… yet gold has basically traded sideways.
This is one of many signs of underlying strength in the gold market.
(Click on image to enlarge)
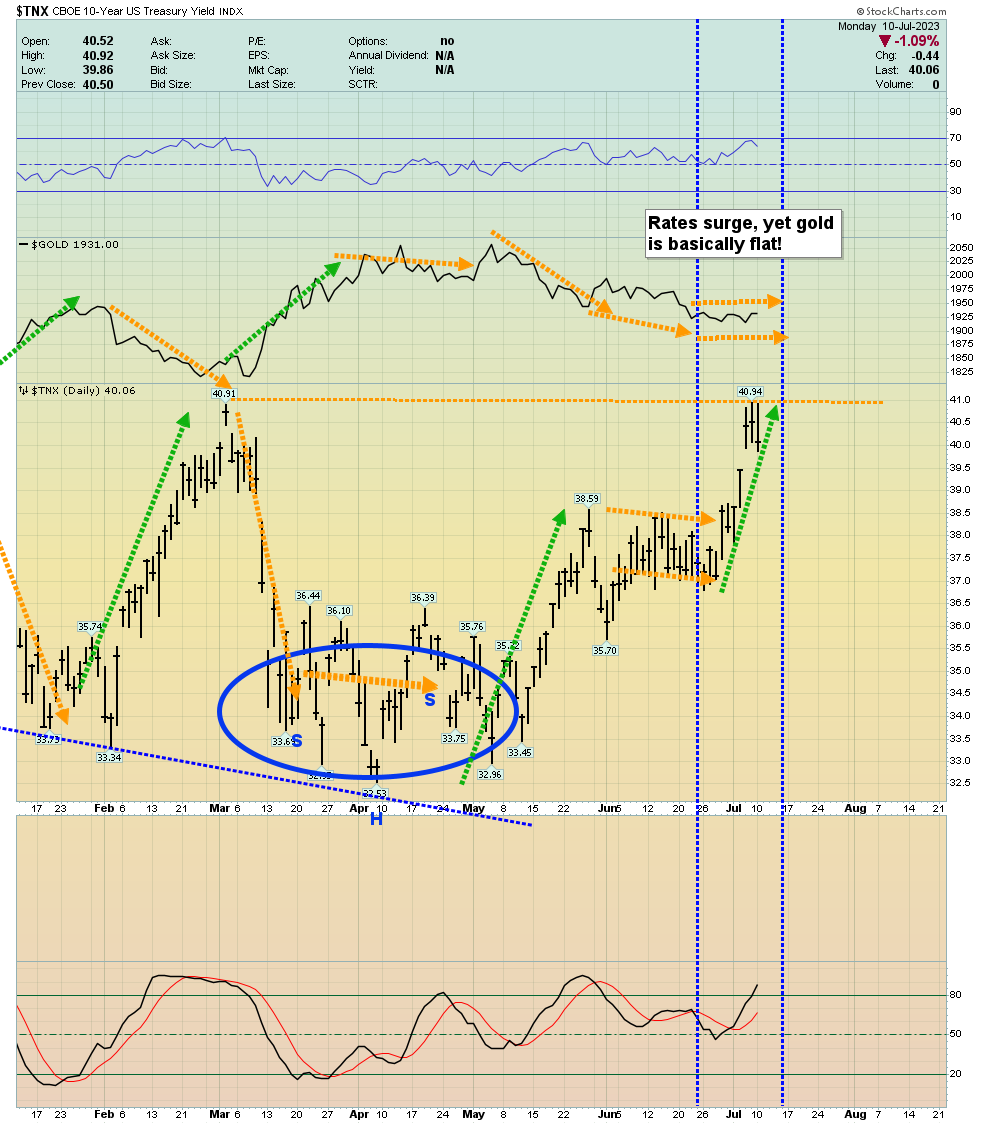
stunning “rates and gold” chart
Gold’s price action can lag interest rate changes… or lead them. It’s possible that the current sideways action in gold suggests that US rates are peaking.
That’s good news for all gold and silver bugs.
It’s also possible that the price action hints that a new wave of inflation is imminent. Could it be like the inflation surge that happened when the Ukraine war began?
For some insight into this key matter,
(Click on image to enlarge)

The first phase of the war saw the dollar surge against the ruble and...
The technical groundwork has been laid for a repeat of that surge again.
What about oil?
(Click on image to enlarge)

There are two rectangles in play on this daily chart for oil. They look like base patterns more than continuations.
A move to $93-$100 looks increasingly likely.
America’s favorite draft dodger and elderly war worshipper is, of course, Joe Biden, aka “The American Chucky Doll”.It appears that he has successfully dumped enough oil out of the nation’s Strategic Petroleum Reserve (SPR) to keep oil (and thus pump gas) from surging. That means most citizens stay relatively quiet while he sends debt-funded cluster bombs to future Ukraine playgrounds.
Unfortunately for him, and fortunately for the citizens of Ukraine that he hasn’t ruined yet, there’s a limited amount of oil in the SPR.
At some point Joe will have to stop dumping SPR oil and when he does… US inflation should move higher very quickly.
That will cause “stagflated” US citizens to rise and demand an end to this insane war. Gold could trade significantly higher during this period of turbulence.
For a look at the weekly gold chart,
(Click on image to enlarge)

Note the position of the RSI oscillator at the top of the chart and Stochastics at the bottom.
When the weekly chart RSI bottoms around 50 as Stochastics bottoms around 20, it’s typically a sign of a strong market for gold.
(Click on image to enlarge)

DXY (dollar index) chart
A move under 100 would activate a descending triangle pattern and likely coincide with a huge rally for gold against fiat.
(Click on image to enlarge)

short-term SGOL (gold ETF) chart
Key moving averages have flattened out as an inverse H&S pattern comes into positive play.
As a loose rule of thumb, Tuesdays tend to be soft for gold, but today could be an exception.
Given all of the above, it’s clear that investors need to be gold and silver market nibblers, at a bare minimum. Gamblers can go larger, with a stoploss.
What about the miners? The mining stock charts are at least as impressive as gold.
(Click on image to enlarge)

short-term GDX chart
There’s a double-bottom pattern in play, and volume surged yesterday with key moving averages set to flash a fresh buy signal.
(Click on image to enlarge)

The short-term chart looks good, but this weekly chart is much more important… and it looks very positive as well.
The bottoming Stochastics oscillator for GDX suggests all gold stocks enthusiasts should be nibblers here and now, and more aggressive investors should consider some meatier buys!
More By This Author:
Gold, Stocks, And Miners - The Markets Get Wilder
Gold Price Sale Key Tactics For Investors
The Big Story Is Gold Bug Glory


