Gold And Silver May Need A Breather Before Moving Higher
Image Source: Unsplash
The price analysis last month titled Gold and Silver are Setting up for a Strong Advance in 2023 highlighted that both metals had shaken off the weakness and looked to be headed higher. It concluded by saying…
Shorts are playing with fire as many trends are pointing to a solid advance in prices during 2023.
That said, not even I anticipated how fast gold would come sprinting out of the gates in 2023. It looks like we may be due for a correction or consolidation but both markets still look poised to go higher this year.
Resistance and Support
Gold
Gold had gotten hung up on $1800 many times over the last few years. This time it broke through with a vengeance, blasting right into $1900. The price was at $1630 as recently as November 3rd so the current 20% move up has been fast and furious catching many shorts off guard (more on that next week).
Price advances like this typically run out of steam and need time to consolidate, so it’s hard to remain immediately bullish, but also hard to be bearish.
Outlook: Neutral
Silver
Silver led gold higher and then got trapped around the $24 mark in mid-December. It is consolidating and building a base for the next move higher. Given the time it has spent consolidating, there are reasons to be optimistic.
Outlook: Bullish
(Click on image to enlarge)
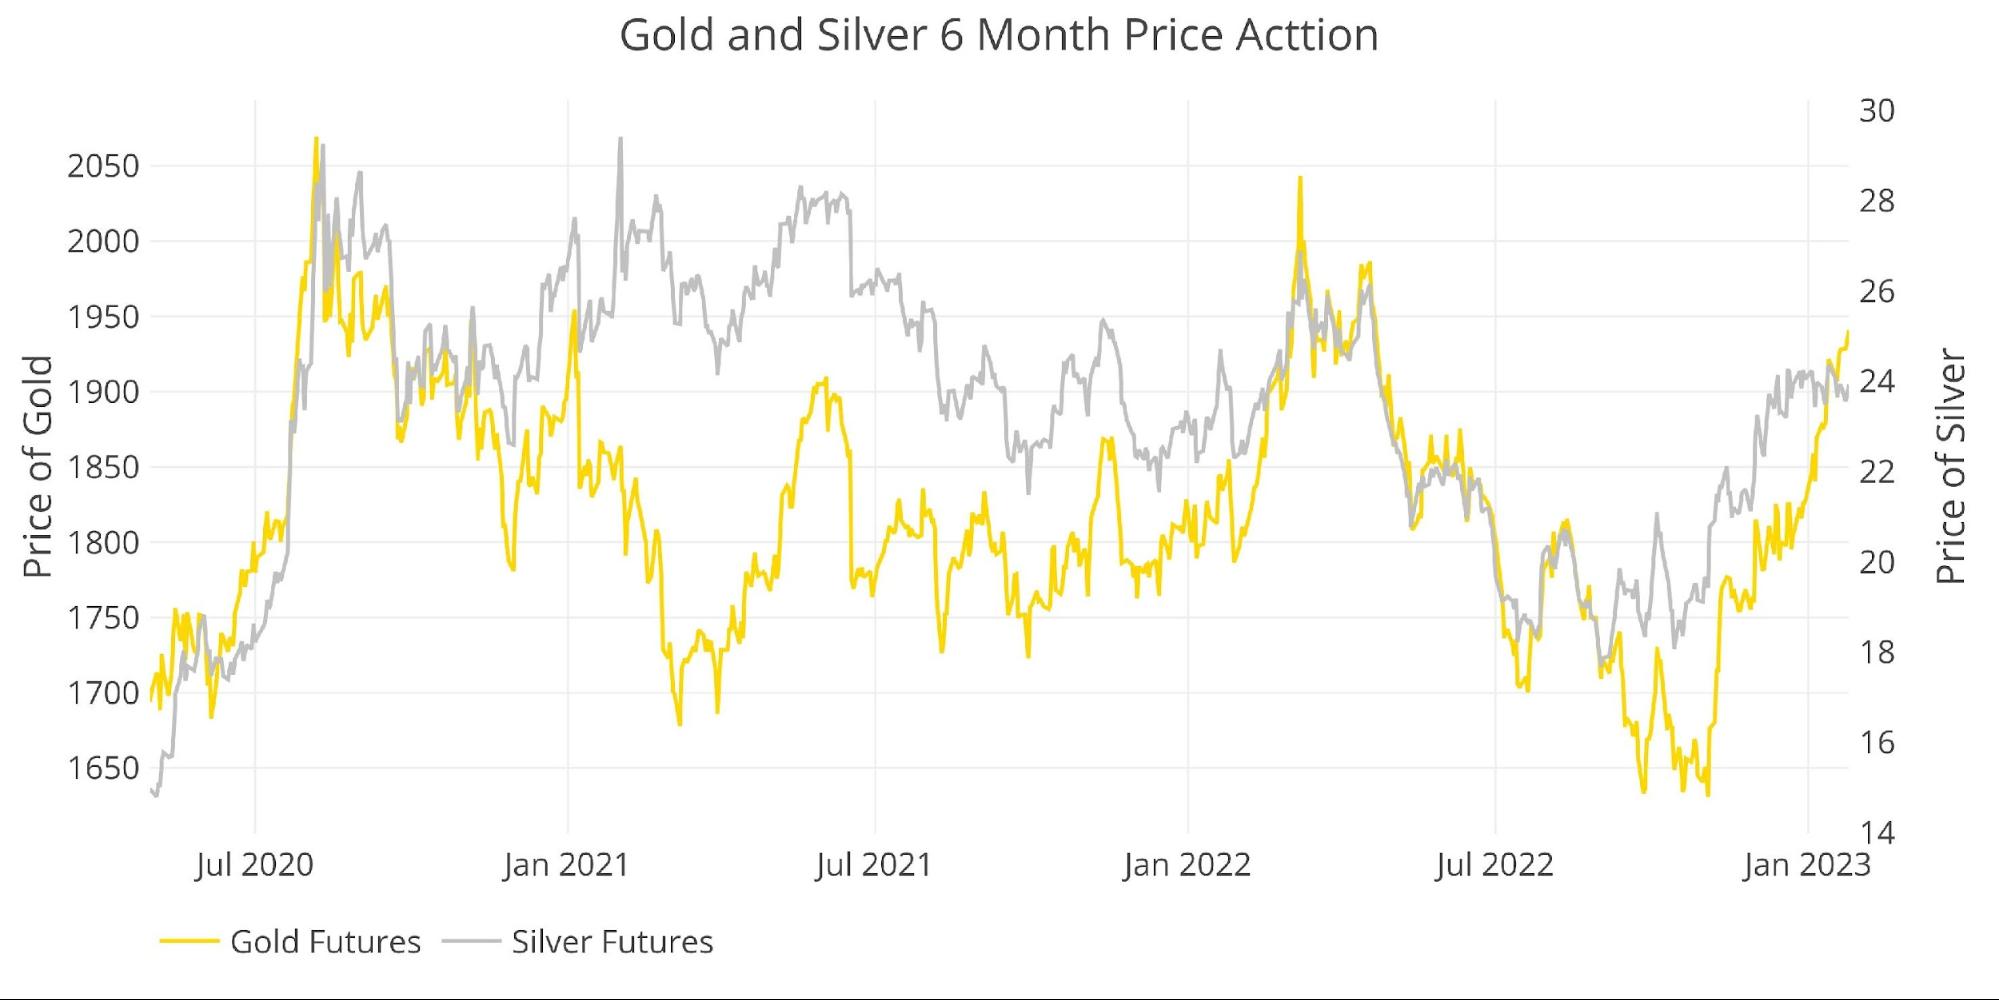
Figure: 1 Gold and Silver Price Action
Daily Moving Averages (DMA)
Gold
Gold formed a golden cross back on Jan 12. The 50 DMA ($1821) now sits comfortably above the 200 DMA ($1787). With the current price ($1946) well above both, the momentum looks set to continue. It’s likely that the 50 DMA needs time to catch up to the price, which will likely require consolidation or a price pullback.
Outlook: short-term neutral medium-term very bullish
(Click on image to enlarge)
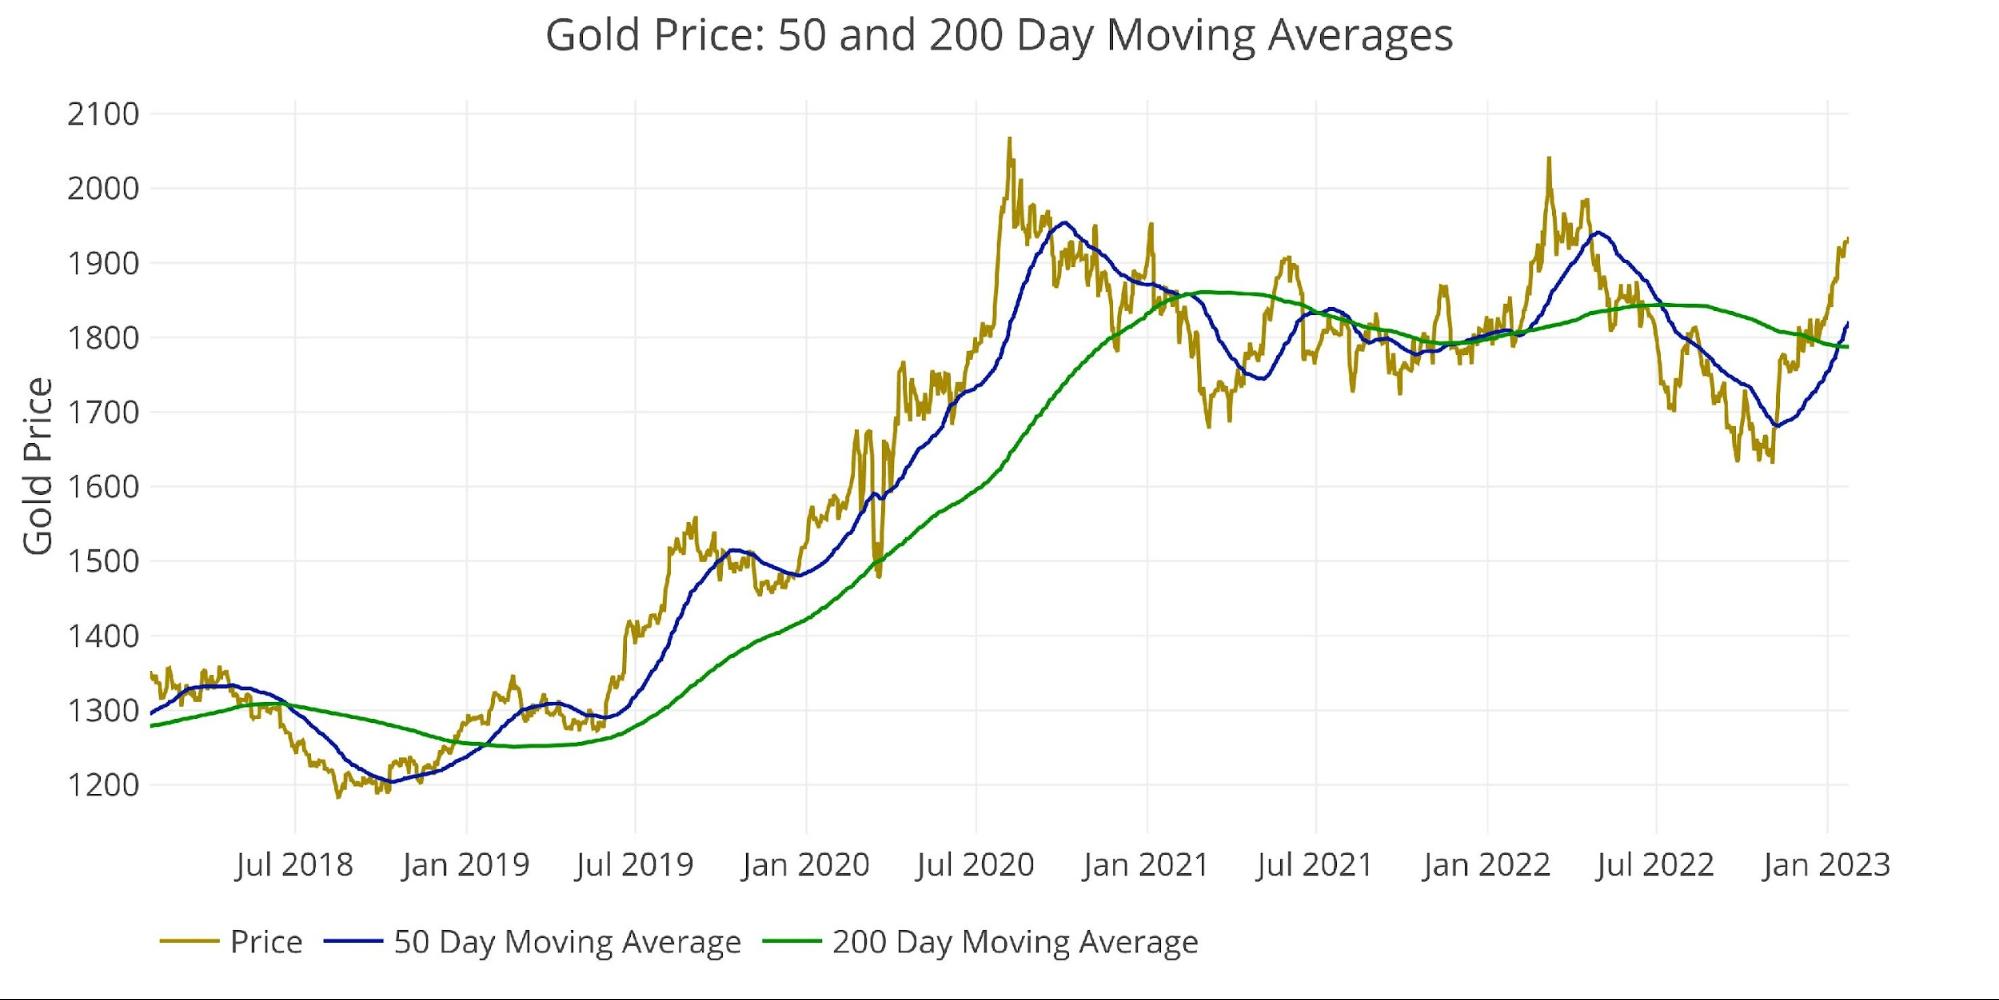
Figure: 2 Gold 50/200 DMA
Silver
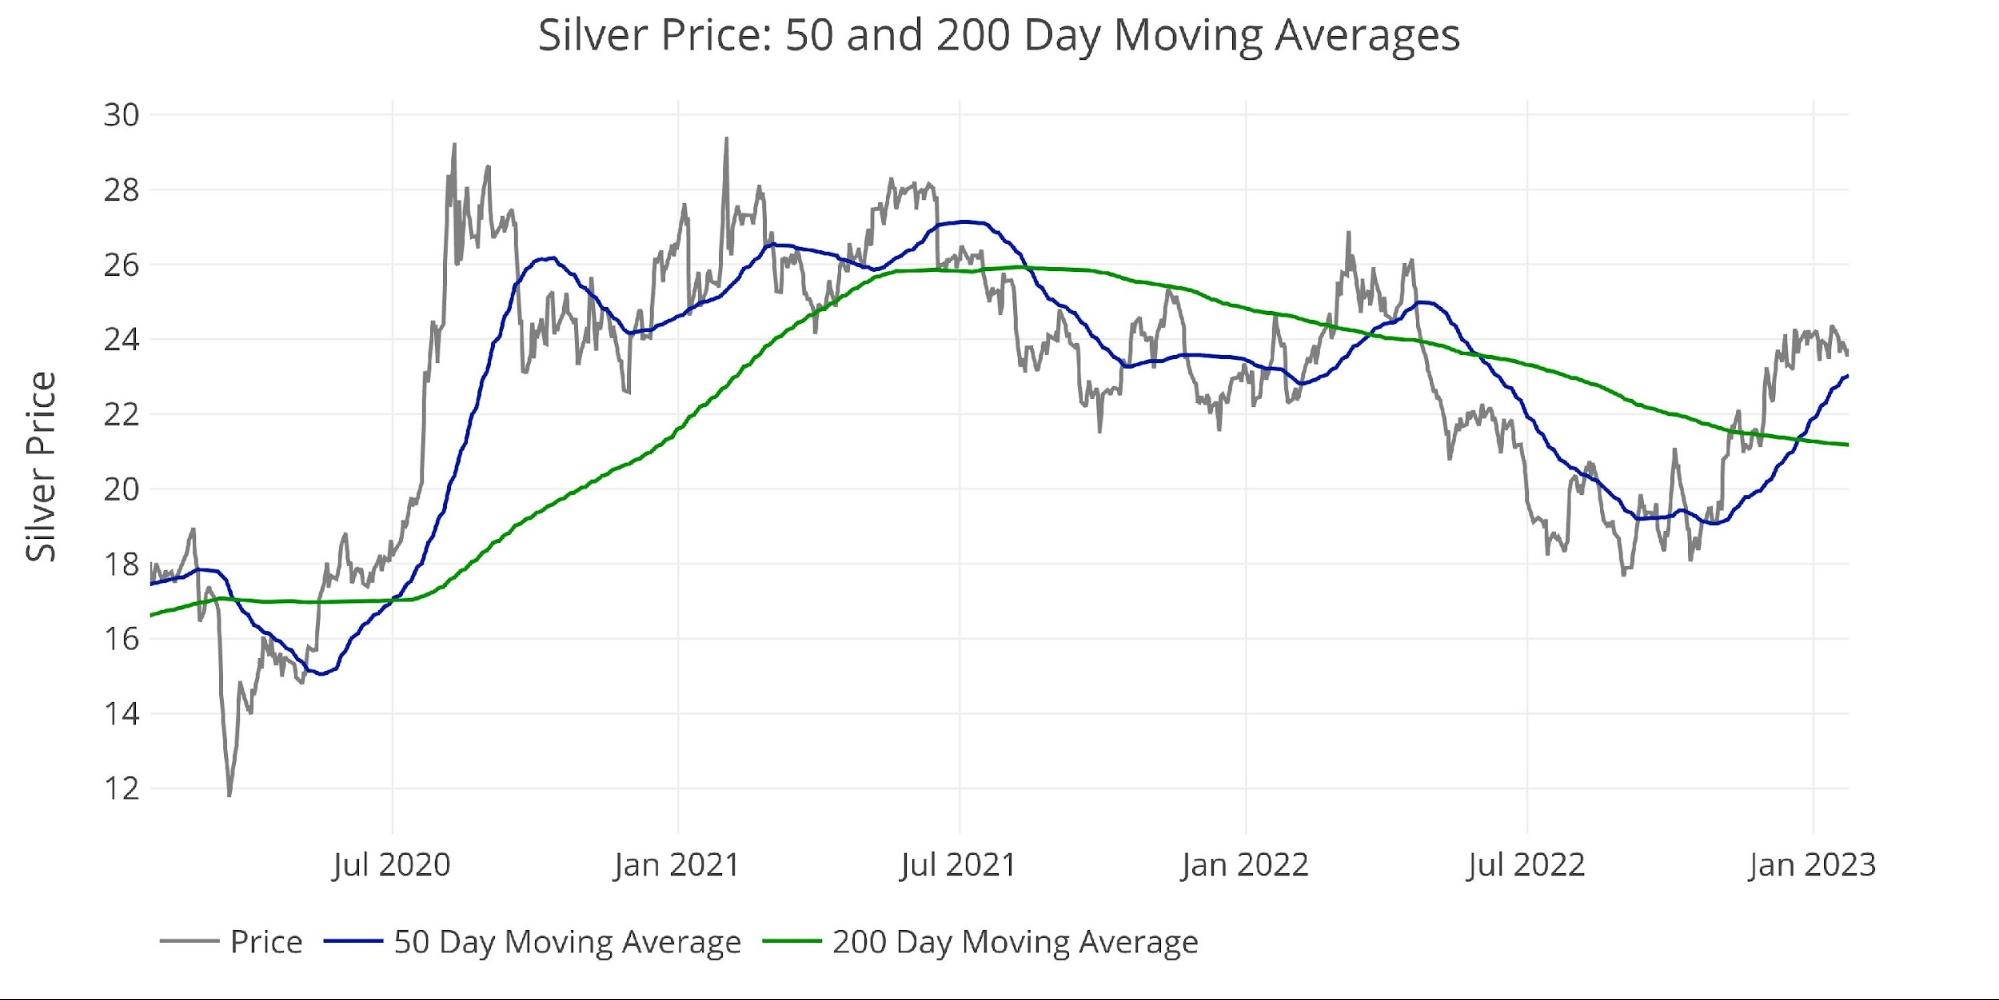
Silver formed a golden cross back on December 23 and then has spent time consolidating. Silver has been leading gold and it is likely showing the market what is in store for gold (consolidation instead of a pullback). After this consolidation finishes, silver will be set to take on $25 which could open the floodgates.
Outlook: Bullish
(Click on image to enlarge)
Margin Rates and Open Interest
Gold
Open interest rebounded from multi-year lows which have led to the recent price advance. It still has lots of room to run though as it sits nearly 300k contracts below the open interest seen in Jan 2020.
The CFTC has raised margin rates twice since December 2nd, but it has done little to slow the price. There is room to raise margin rates higher, but it should only slow the price advance rather than reverse it.
Outlook: Bullish
(Click on image to enlarge)
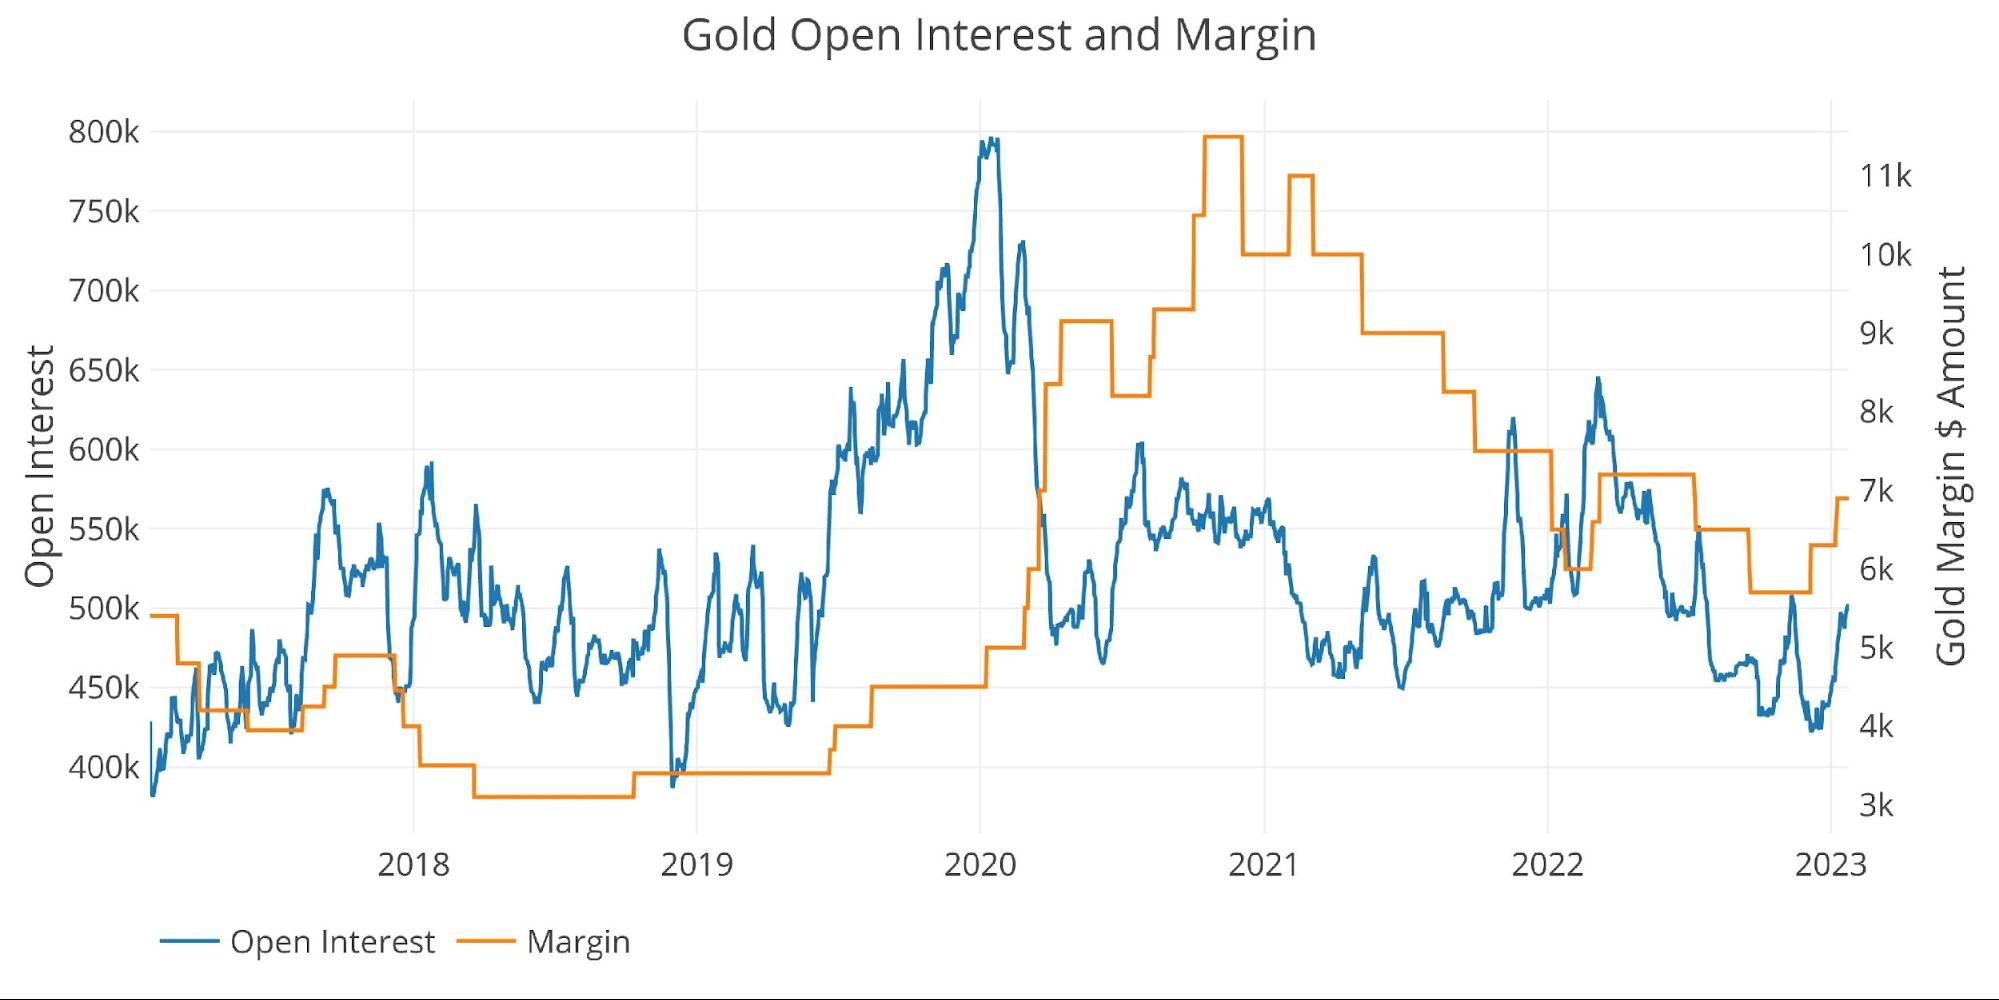
Figure: 4 Gold Margin Dollar Rate
Silver
Silver is in a very similar posture to gold with open interest near the lowest level in years while margin rates saw a recent move higher.
Outlook: Bullish
(Click on image to enlarge)
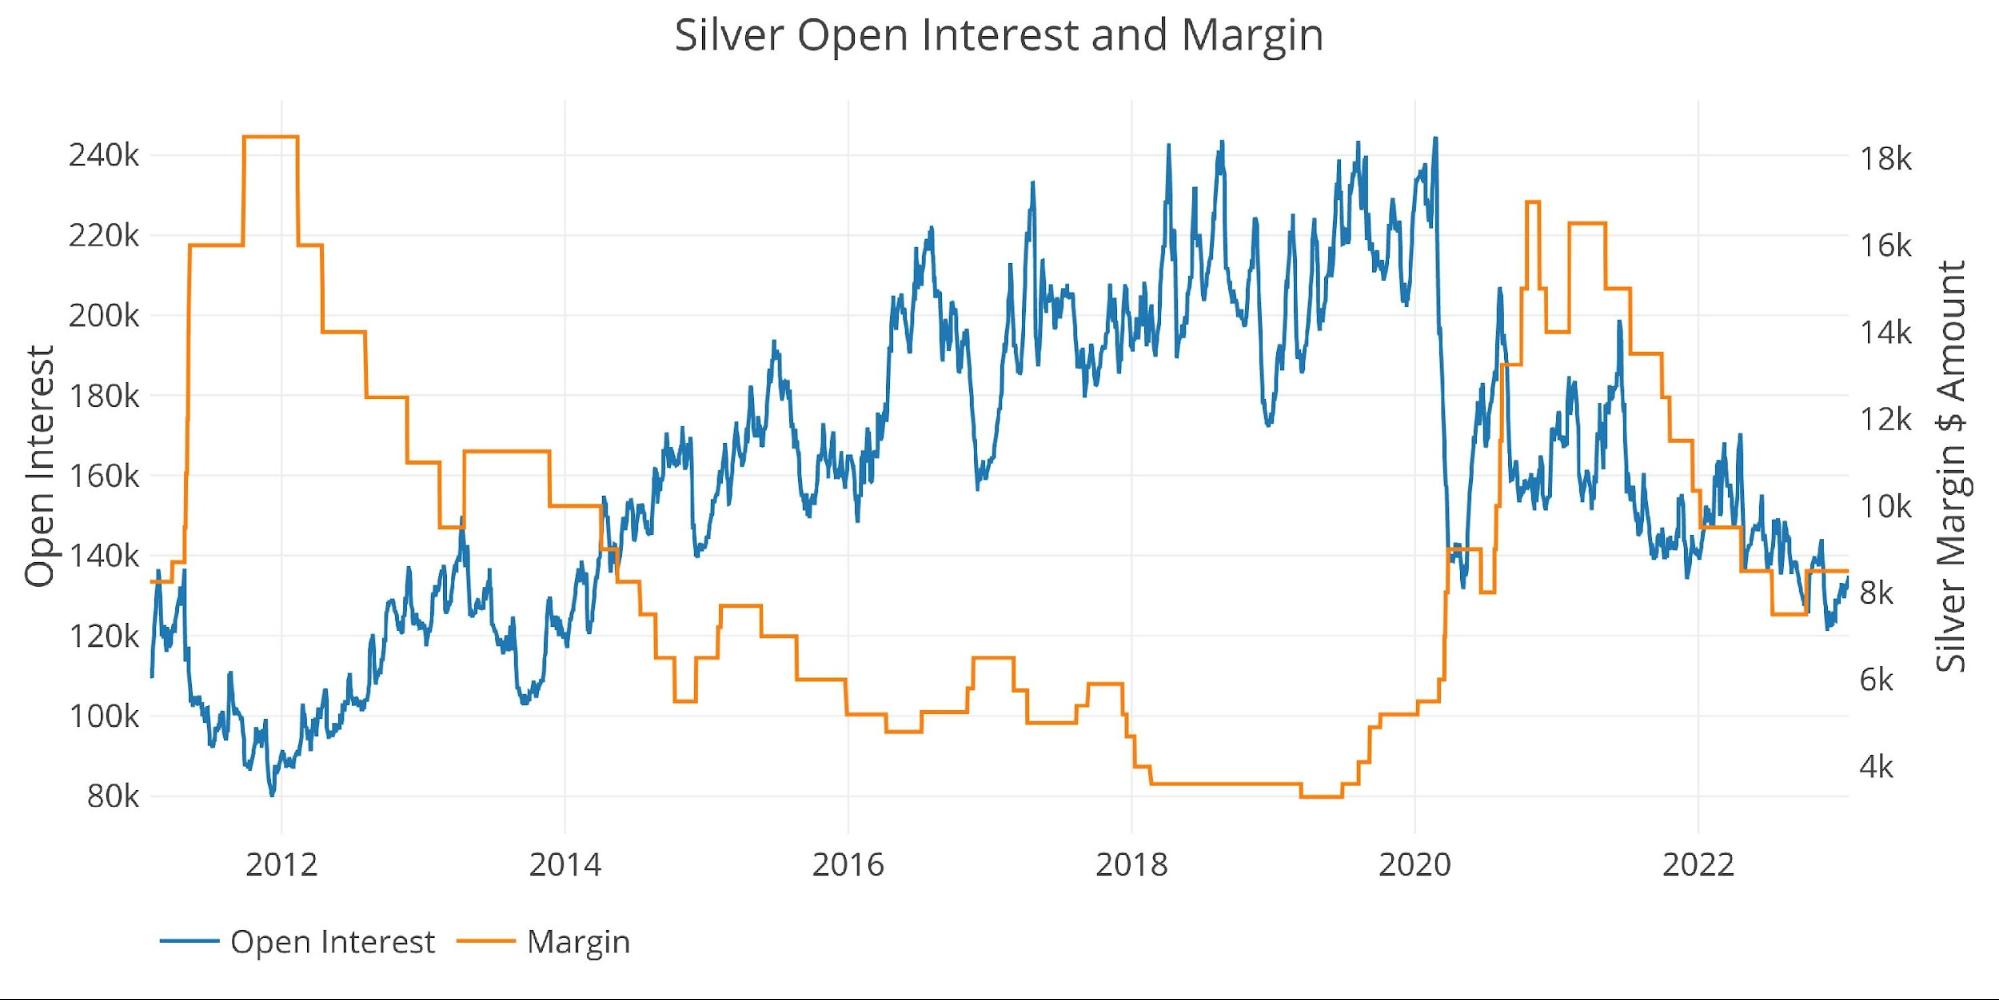
Figure: 5 Silver Margin Dollar Rate
Gold Miners (Arca Gold Miners Index)
The gold miners have been consistently leading the price of gold in both directions for years. The current move in the miners has been strong but less forceful than past moves.
GDX finally broke through $30 and has been inching higher ever since. It definitely was able to front-run the recent price advance, but now both gold and GDX are moving higher in lockstep so the ratio has flattened some. If this bull market was ready to take off, then GDX would be blasting much higher. The stock traders are not fully sold. This means we are in a stealth bull market which leaves plenty of room for an upside. Regardless, you will know gold is prepping to blow through $2000 when GDX starts putting $35 in the rear-view mirror.
Outlook: Cautiously Bullish
(Click on image to enlarge)

Figure: 6 Arca Gold Miners to Gold Current Trend
Looking over a long time horizon shows how badly the miners have underperformed gold over the last decade. This shows traders have never confidently bought into any gold momentum, anticipating price advances will be short-lived. When this trend reverses, gold could start flying higher being led by a surging mining sector.
(Click on image to enlarge)
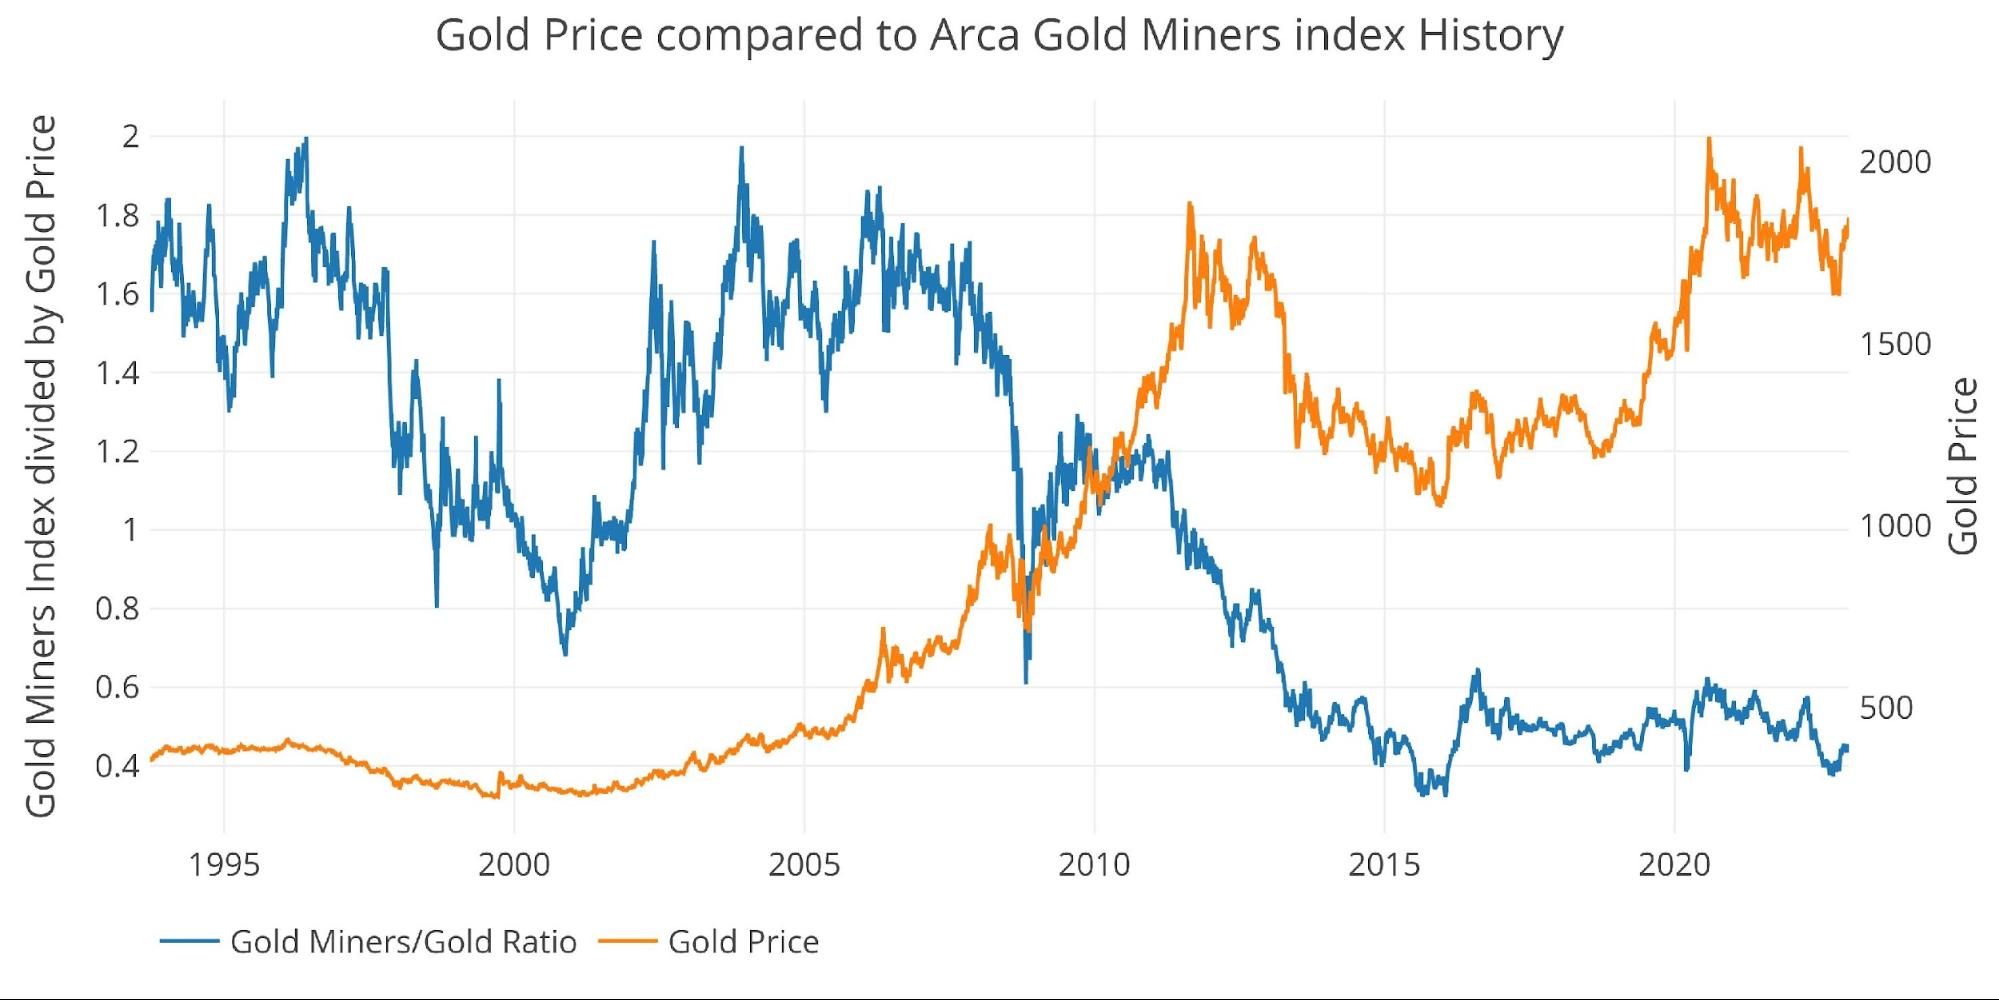
Figure: 7 Arca Gold Miners to Gold Historical Trend
Trade Volume
Love or hate the traders/speculators in the paper futures market, but it’s impossible to ignore their impact on price. The charts below show more activity tends to drive prices higher.
Volume in both metals has picked up significantly since the start of the year which has helped fuel the price advance. These types of moves will eventually run out of steam though, so expect volume to lighten up in the coming weeks leading to a slowdown in the advances or even a correction.
Neutral to Bearish
(Click on image to enlarge)
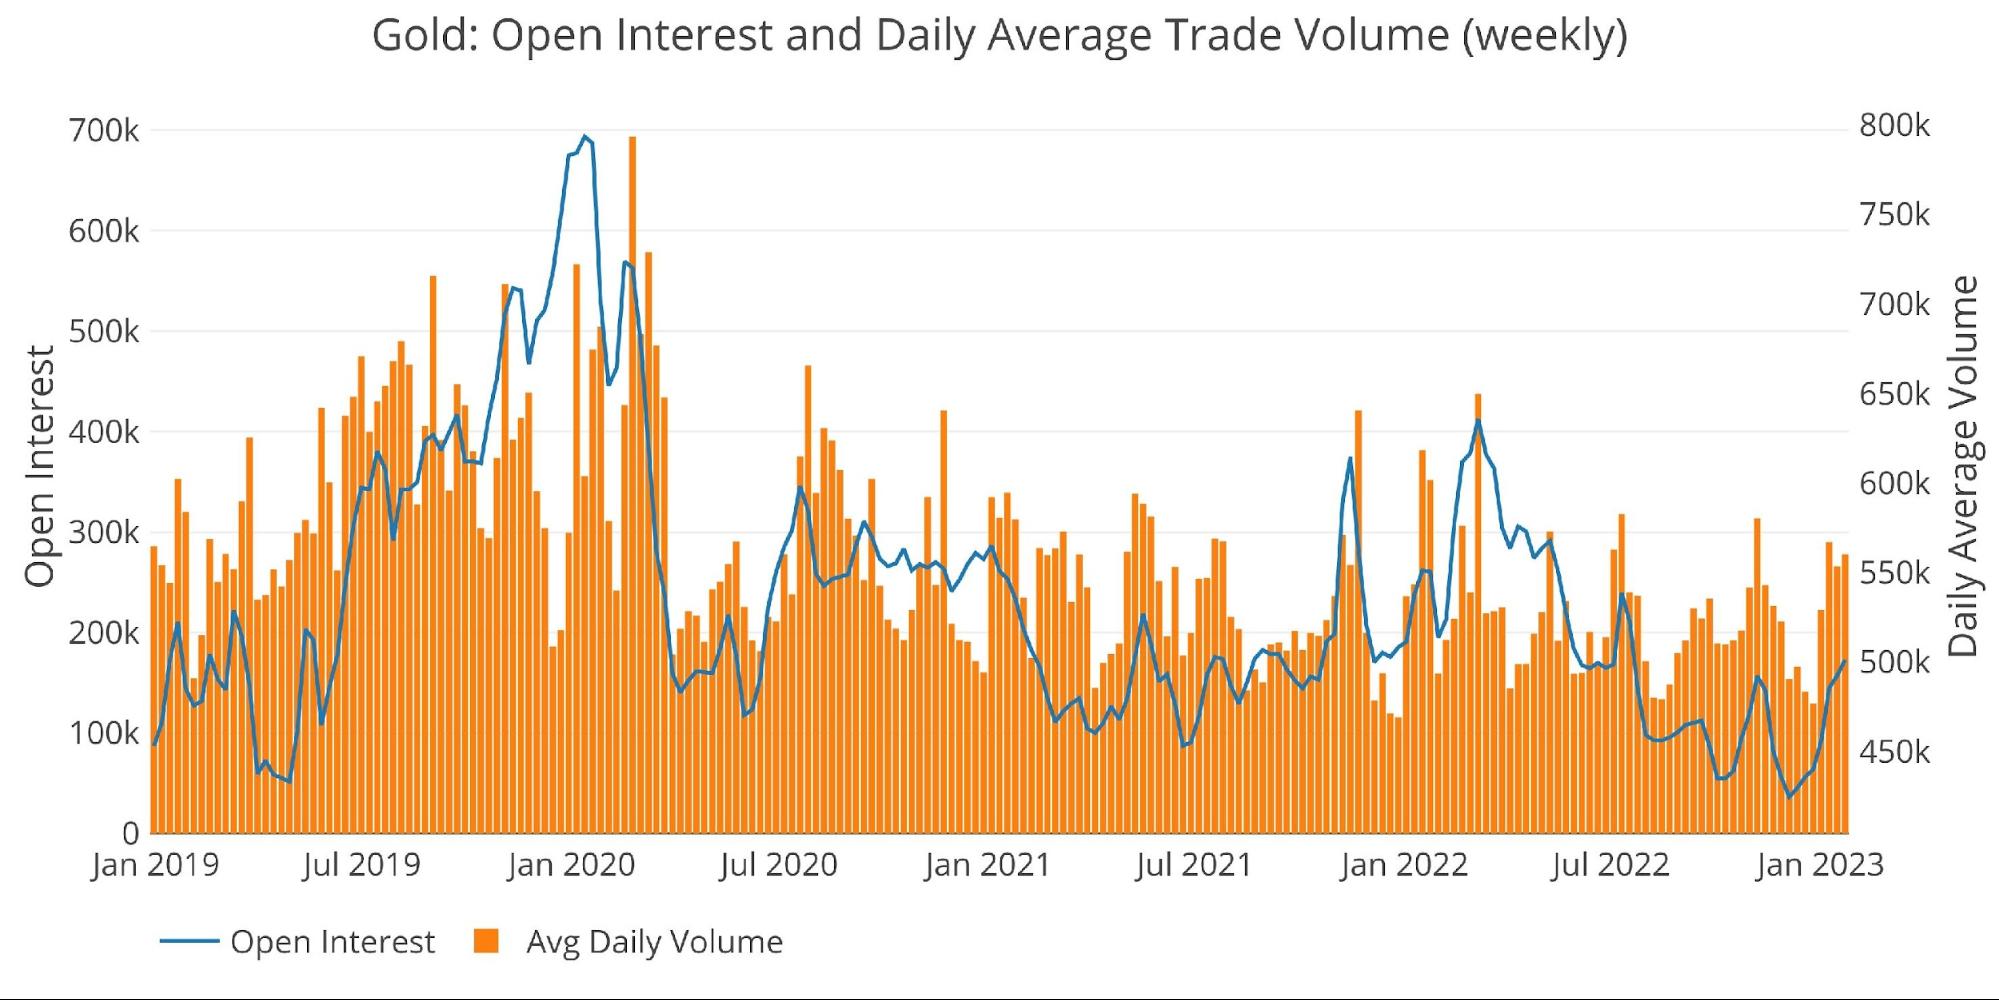
Figure: 8 Gold Volume and Open Interest
(Click on image to enlarge)

Figure: 9 Silver Volume and Open Interest
Other drivers
USD and Treasuries
Price action can be driven by activity in the Treasury market or US Dollar exchange rate. A big move up in gold will often occur simultaneously with a move down in US debt rates (a move up in Treasury prices) or a move down in the dollar.
(Click on image to enlarge)
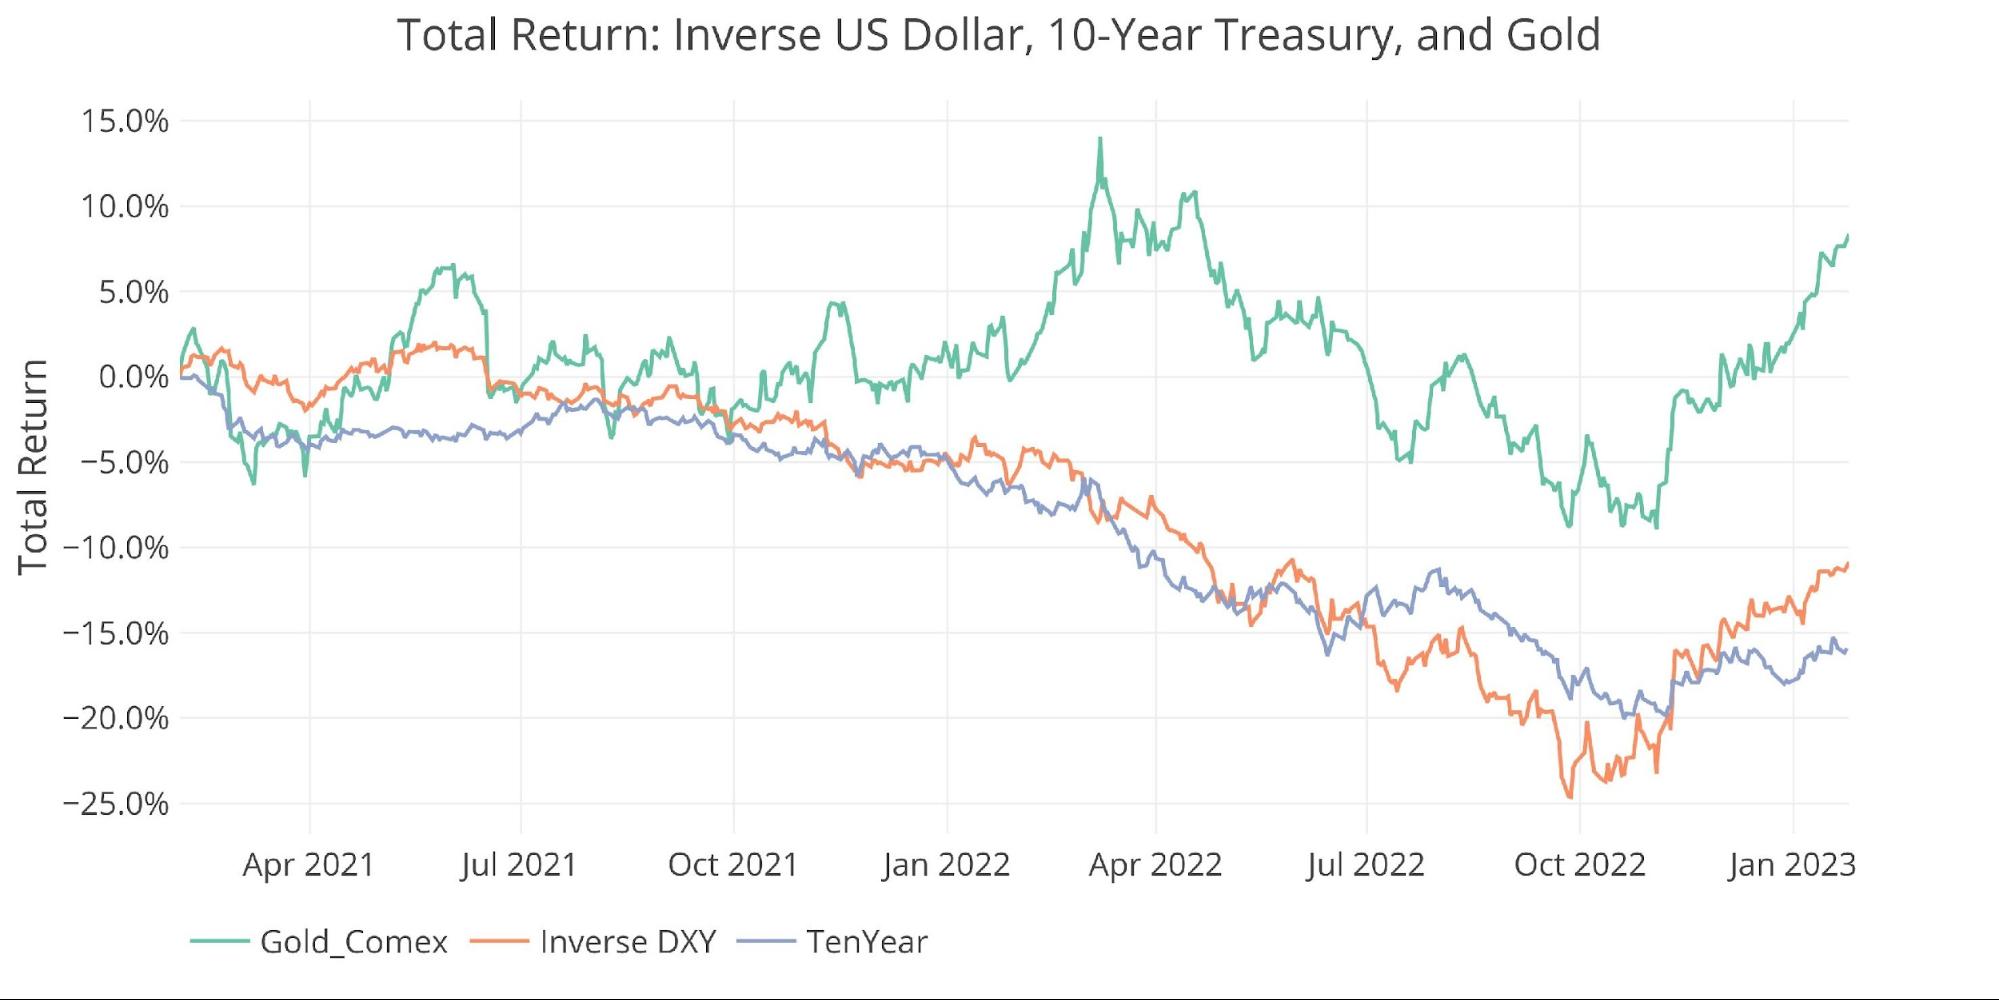
Figure: 10 Price Compare DXY, GLD, 10-year
The weak dollar has been a major fuel behind the recent move in gold. The 10-year has also fallen nearly 100bps and is back below 3.5%. Both of these moves look to have run their course and may seem a reversal soon. The entire market was long USD last year, so it makes sense to see a major reversal. It’s also hard to see the 10-year going any lower until the Fed officially pivots.
Outlook: Neutral – both need time to consolidate
Gold Silver Ratio
The gold-silver ratio has been steadily falling and got as low as 75 in December. Since silver has stalled out, the ratio has turned back upward and is back above 80.
Outlook: Silver bullish relative to gold
(Click on image to enlarge)
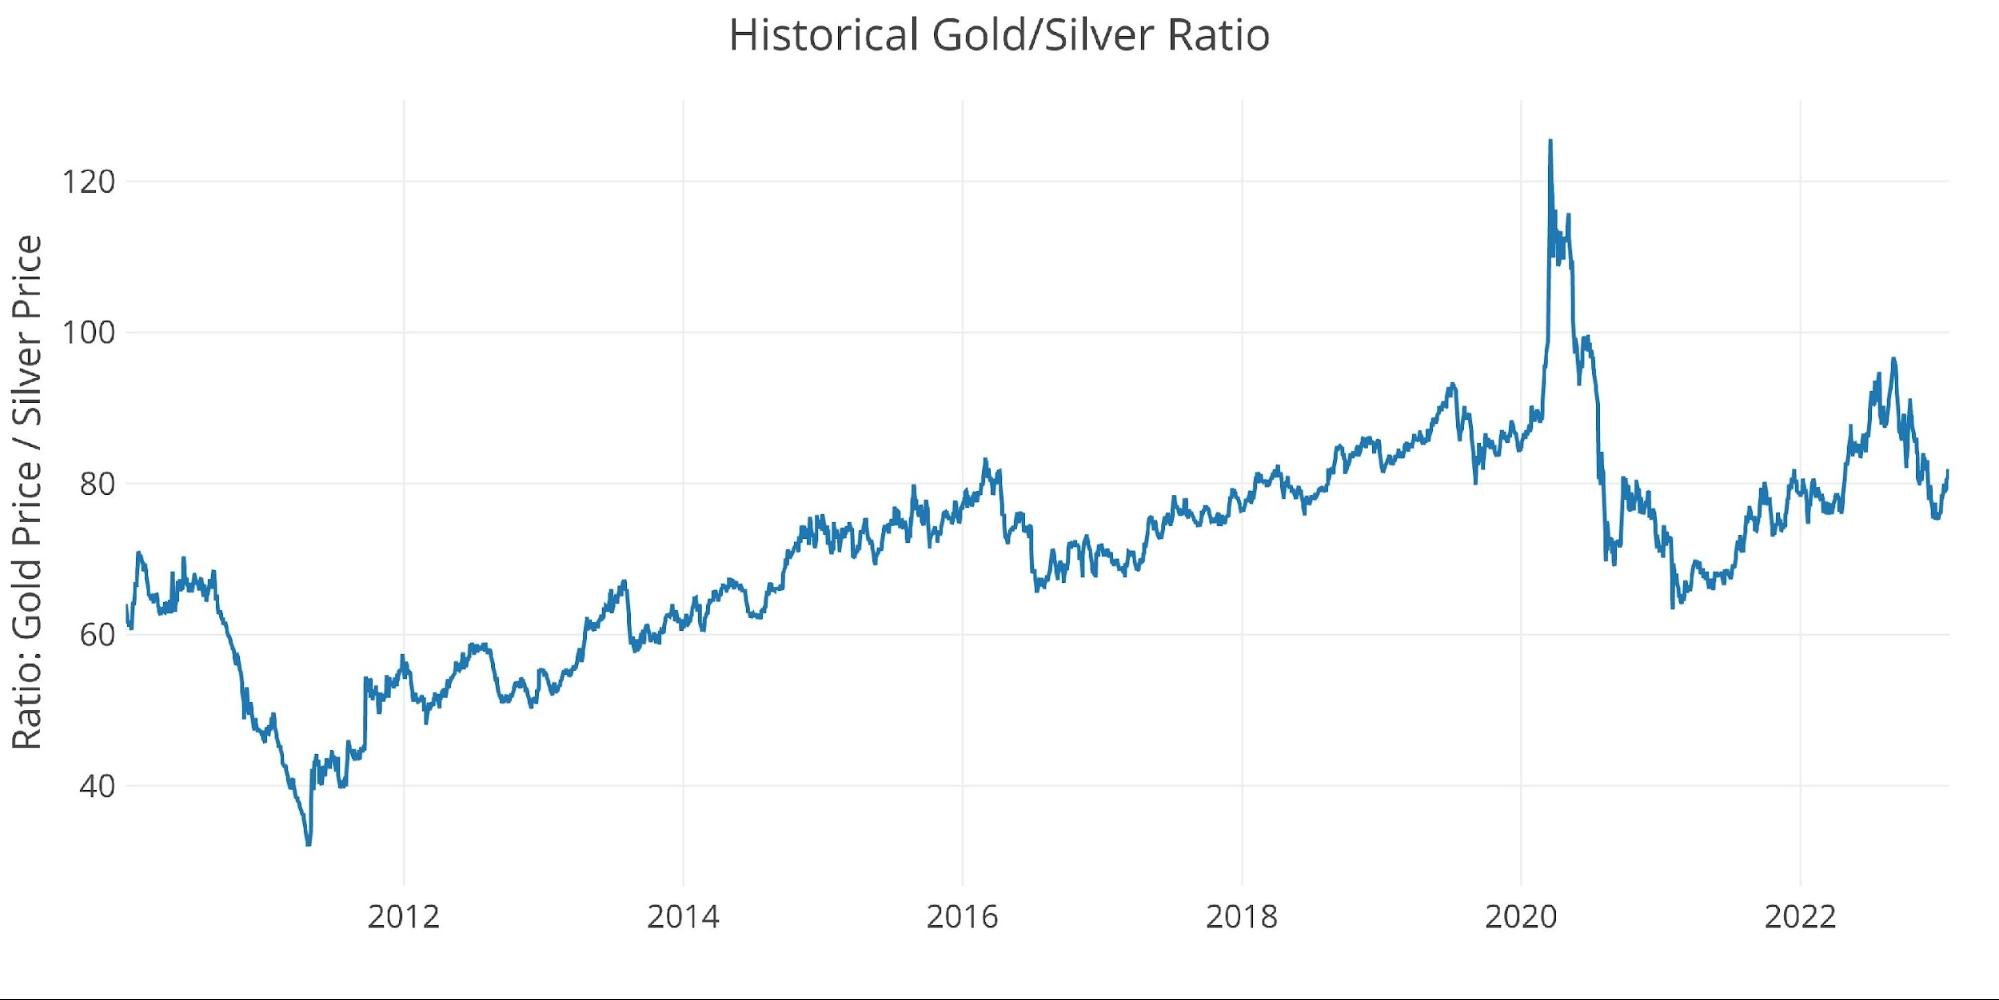
Figure: 11 Gold Silver Ratio
Bringing it all together
The table below shows a snapshot of the trends that exist in the plots above. It compares current values to one month, one year, and three years ago. It also looks at the 50 and 200-daily moving averages. While DMAs are typically only calculated for prices, the DMA on the other variables can show where the current values stand compared to recent history.
-
- Silver is down 1.8% after rising 11.3% the previous month. Gold took the spotlight this last month, rising 6%. *This was highlighted as a high-probability event in the analysis last month
- Open interest is up 13% in gold and 4.6% in silver
-
- Gold is above the 200 DMA open interest, but silver is not – this means silver may be ready for its next move up
-
- The HUI Gold ratio fell because the gold price moved up faster than the miners
(Click on image to enlarge)
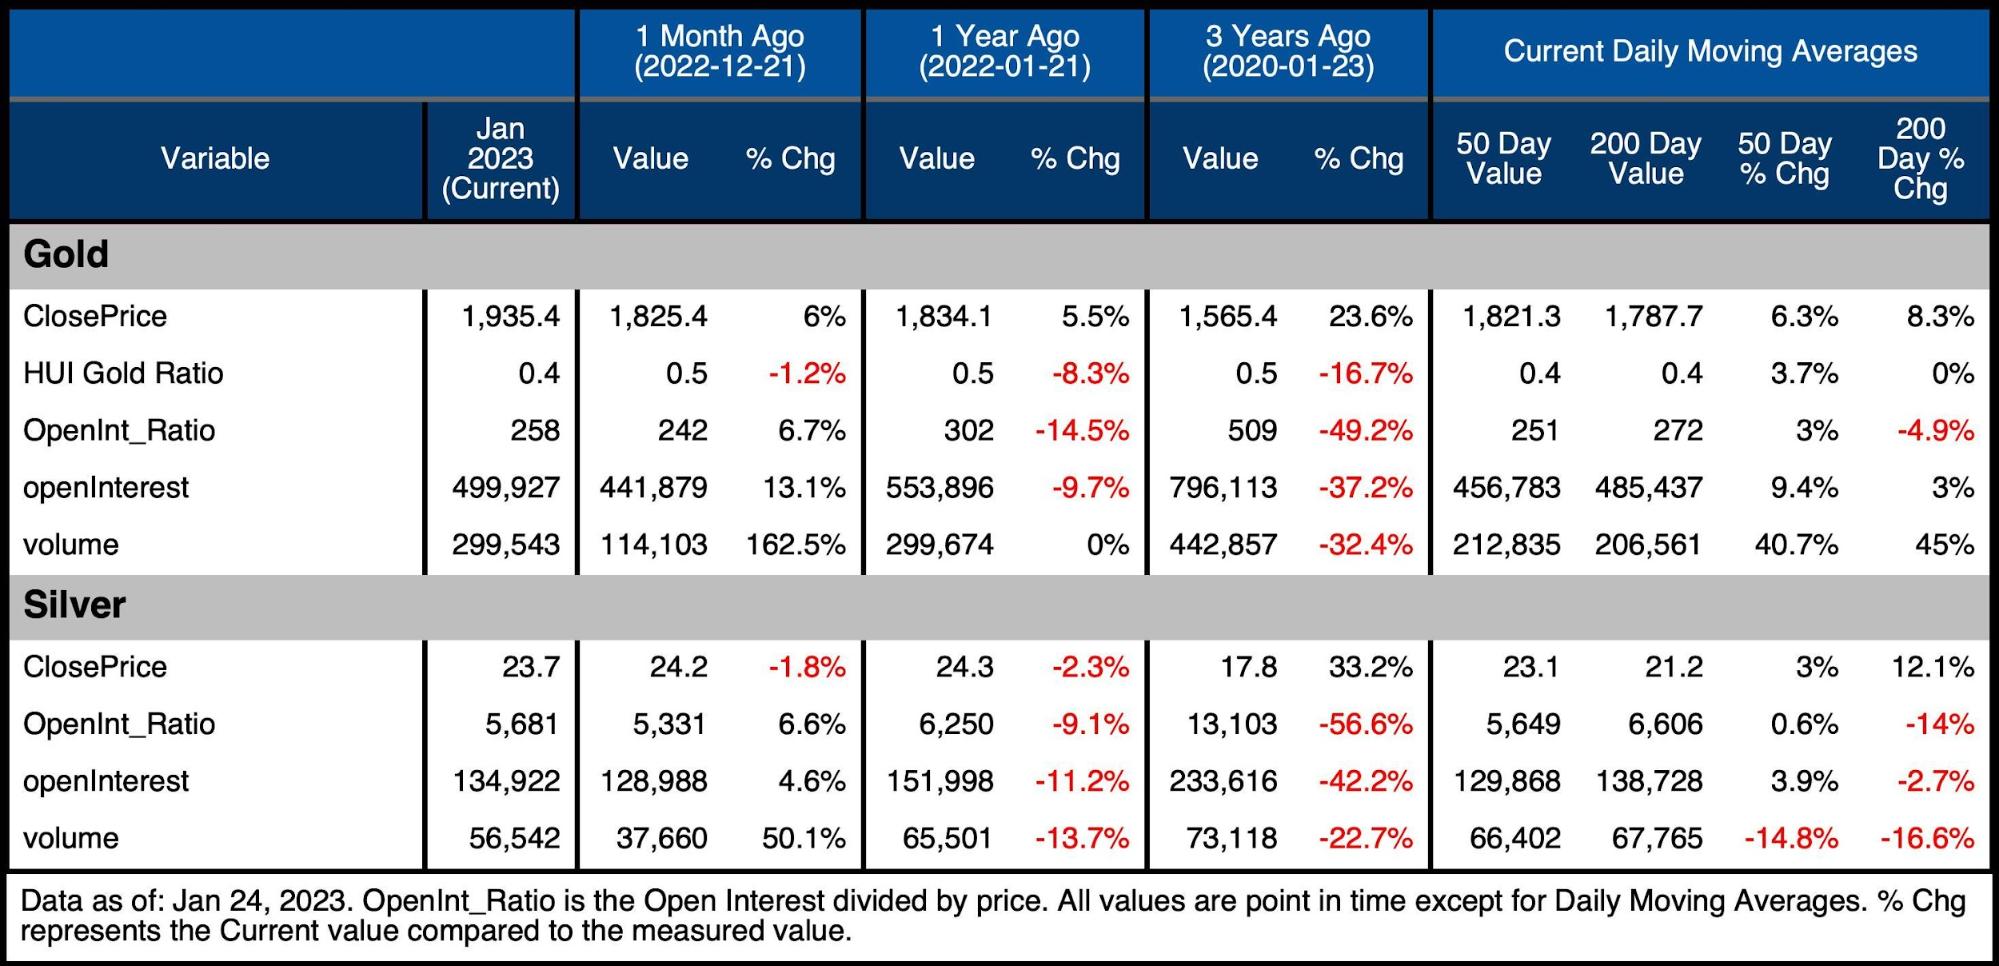
Figure: 12 Summary Table
Wrapping up
Nothing moves straight up. Even though the consolidation in gold and silver lasted more than two years (Aug 2020 – Dec 2022), markets always need time to rest and recover. The current move has been very strong, but gold does not yet look ready to take on $2000 and attack new all-time highs.
Silver is leading gold and is ready to take a stab at $25, but the real test will come at $30.
In either case, both metals look to be in upward trends that should push prices higher in 2023. There will be corrections along the way, but these should be viewed as buying opportunities.
Data Source: https://www.cmegroup.com/ and fmpcloud.io for DXY index data
Data Updated: Nightly around 11 PM Eastern
Last Updated: Jan 24, 2023
Gold and Silver interactive charts and graphs can be found on the Exploring Finance dashboard: https://exploringfinance.shinyapps.io/goldsilver/
More By This Author:
Why Are Central Banks Buying Gold?
Money Supply Shrinks In 2022 For The First Time On Record
Comex Update: Gold Deliveries Pick Up Late In The Contract


