
Gold & Silver ETFs Continue To See Inflows
Photo by Dmitry Demidko on Unsplash
It was somewhat of a quiet week, that ended on a quiet note, especially given what was happening at this time last week.
Silver did not end up breaking $40 this week, and actually traded lower over the week, although still ended up at the $38.44 level.
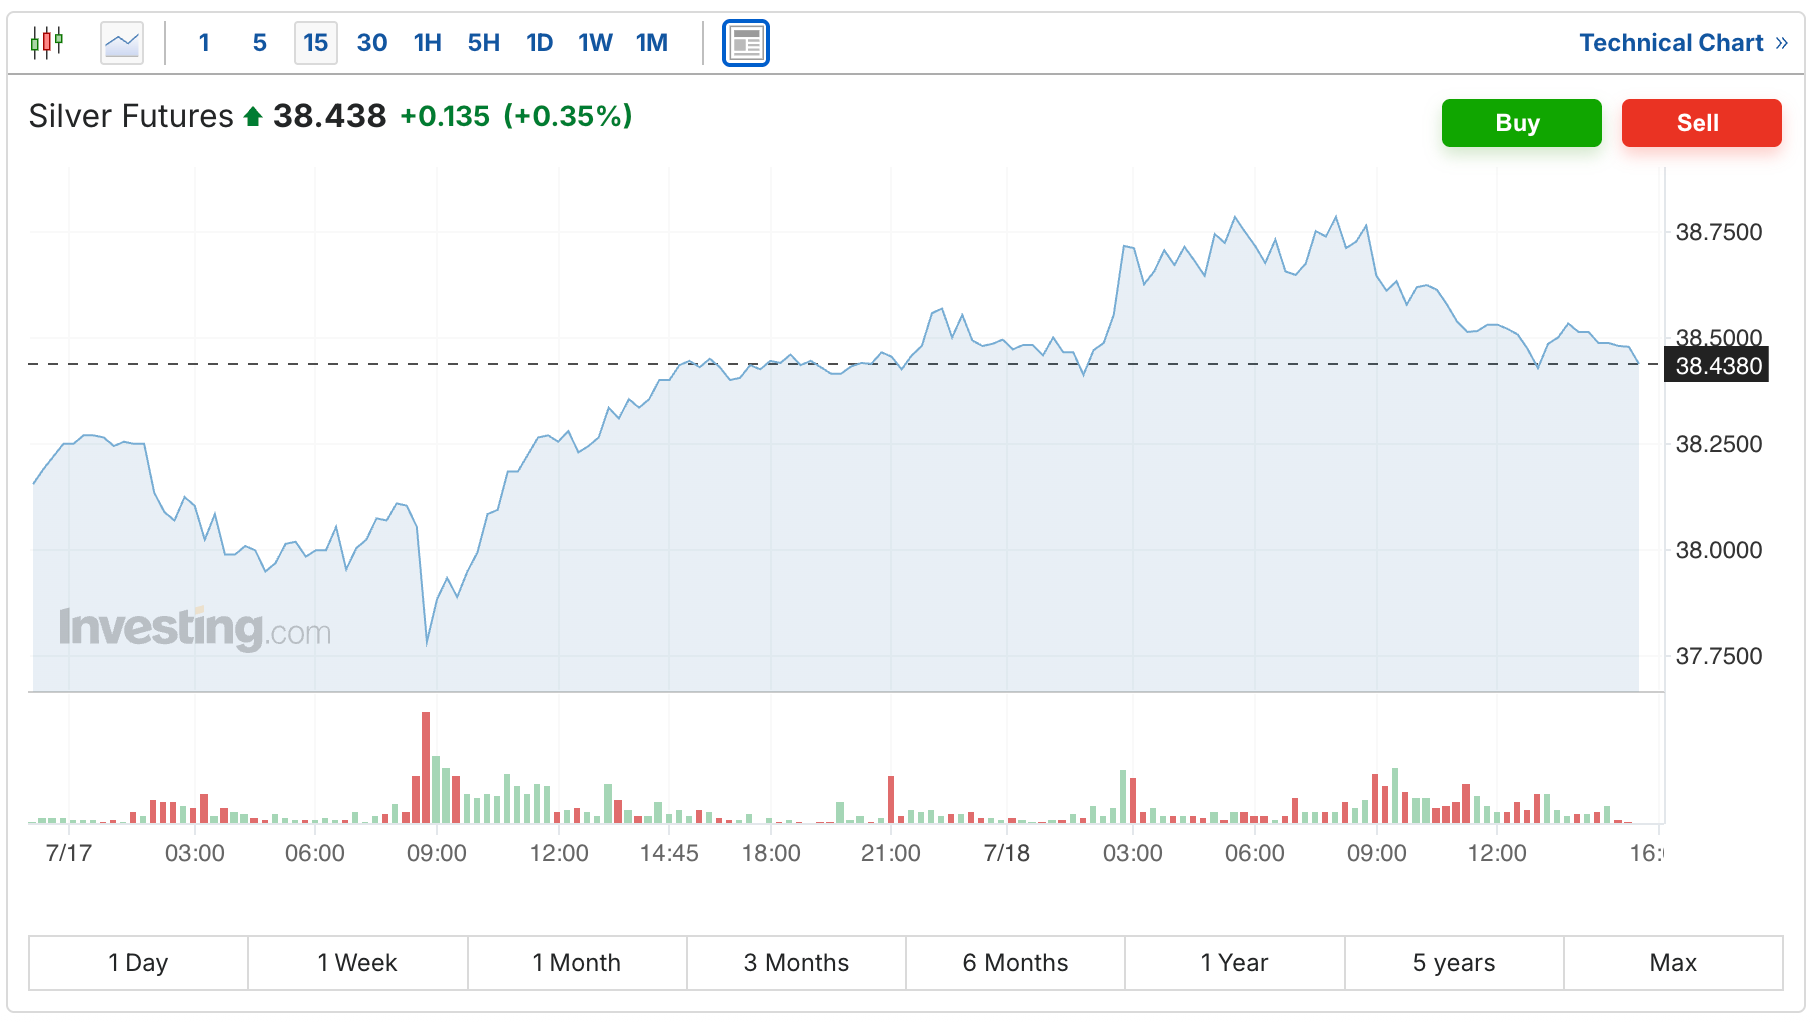
The high of the week, and of the 18-month rally remains $39.57, which was notched on Monday morning.
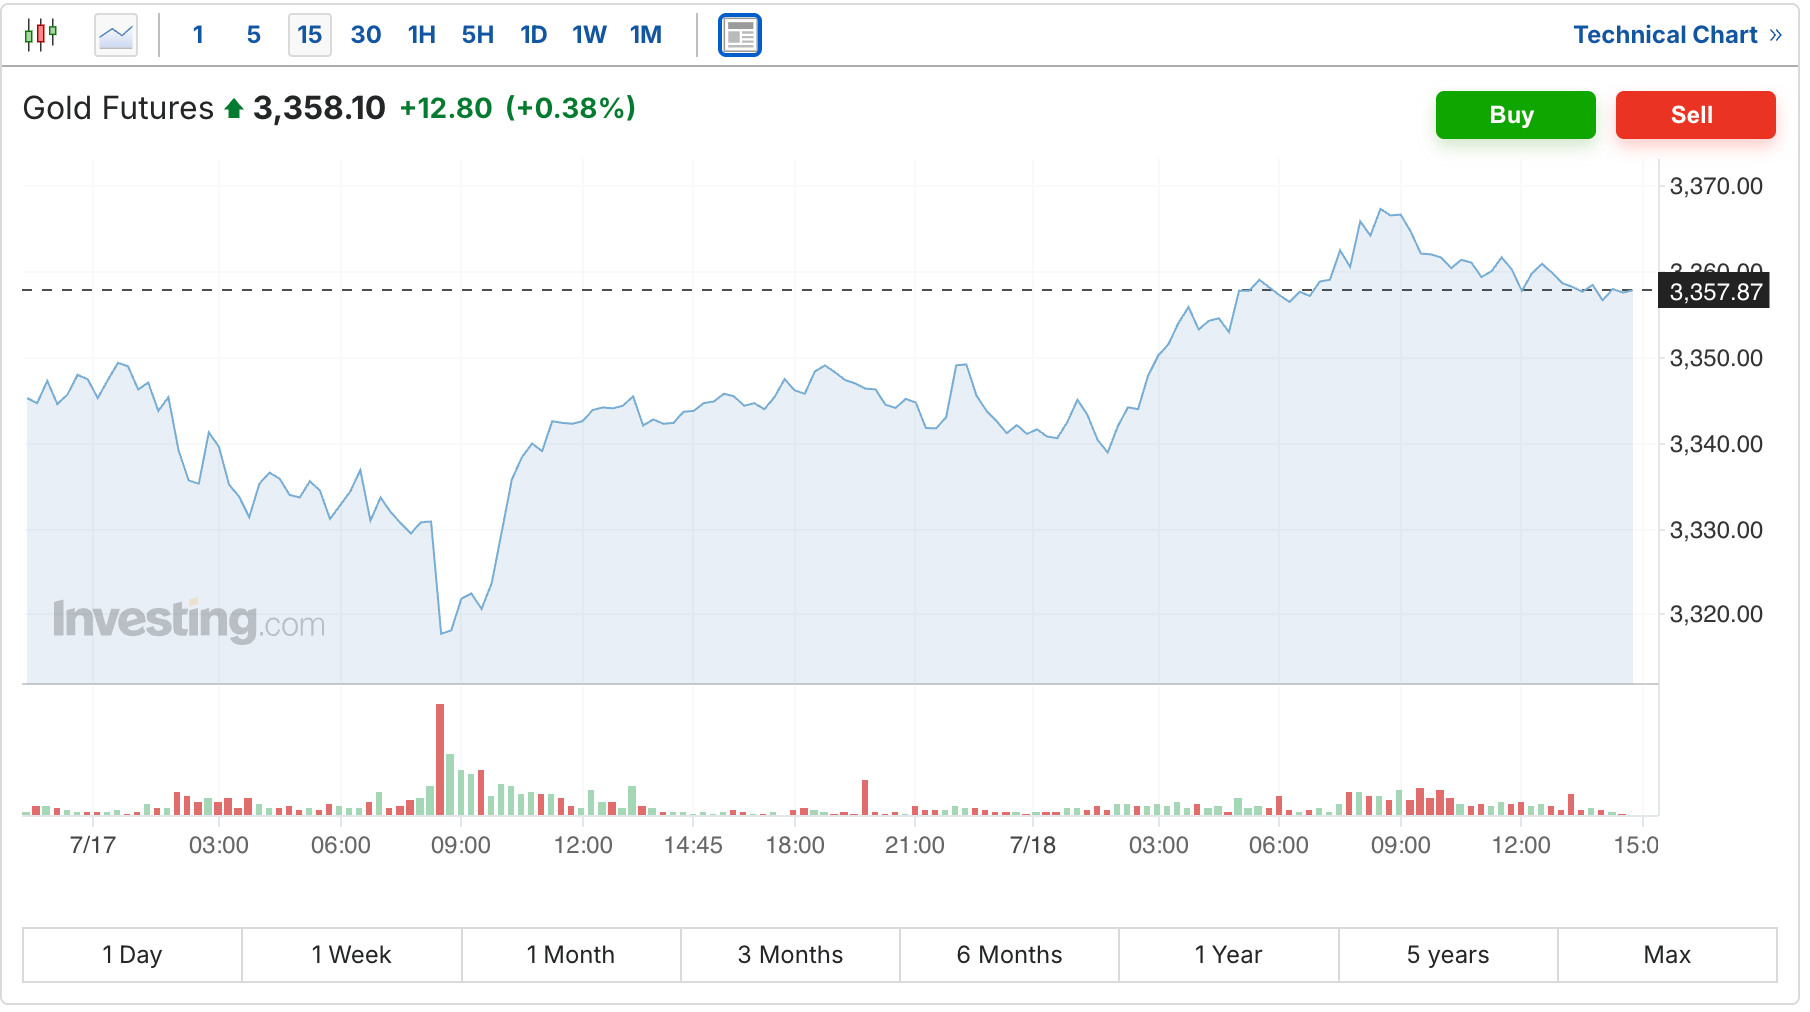
The gold futures were up another $13 to $3,358.
In some ways it’s not surprising to have a quiet week like this, as on Wall Street it’s generally a down time as many of the bankers and traders like to head out to the Hamptons. And perhaps it's just a good time in general to have a bit of a breather. Especially given the frenetic pace of the first 6 months of the year.
But I do have a few charts that will help put some of the key trends in gold and silver in context before we call it a week.
In this first one, you can see the inflows into the gold ETFs (the blue line), and how almost 18 million ounces of gold have been added since money started flowing in last summer as it became clear the Fed was getting ready to start cutting rates (there were 100 million ounces in the ETFs, and with the additions, that figure is now up to 118.857 million ounces).
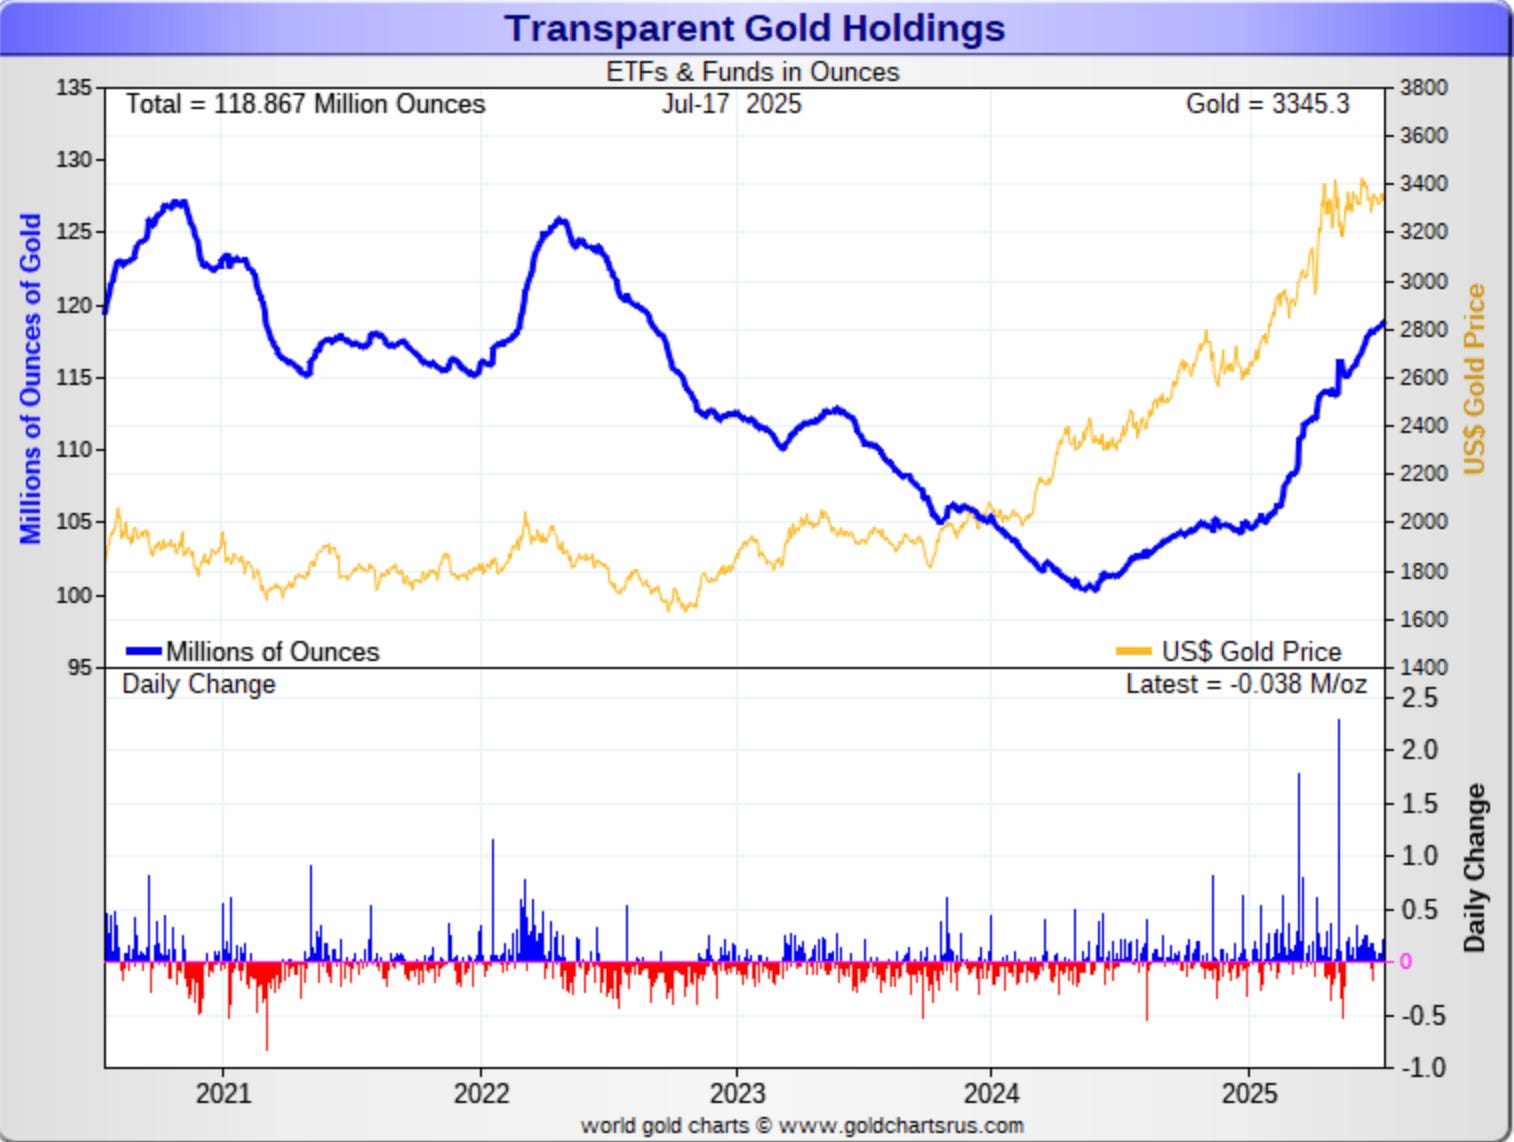
Of course you can also see how this was a big shift after years of outflows.
There was a similar picture in silver, where the outflows began after the Silver Squeeze of 2021, yet we’ve seen about 185 million ounces added to the ETFs since last summer.
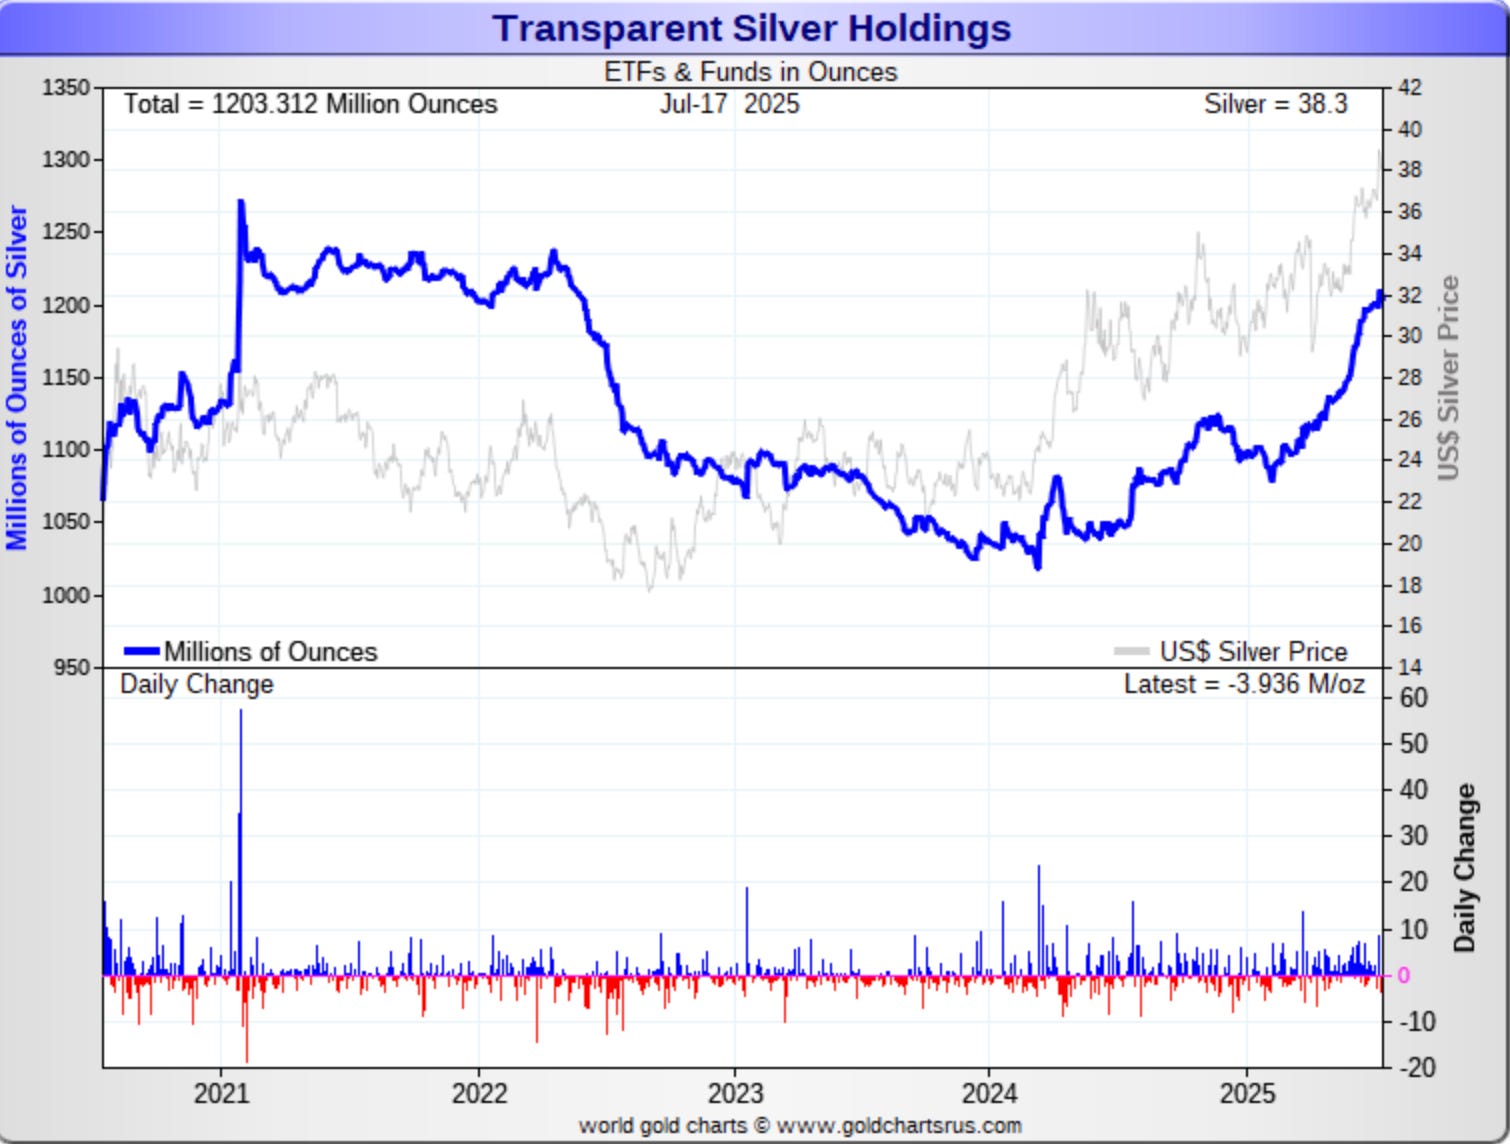
In terms of what those inflows actually say about the market, I tend to think of the ETF flows as a good barometer of Wall Street institutional demand. And these patterns match what I’ve been hearing in general, and in particular what I heard when I was at the Rick Rule Symposium last week.
As for the COMEX gold inventories, you can see how there’s been a steady decline since 2021, which reversed last year, and then accelerated this year as gold flowed from London to New York due to the tariff uncertainty.
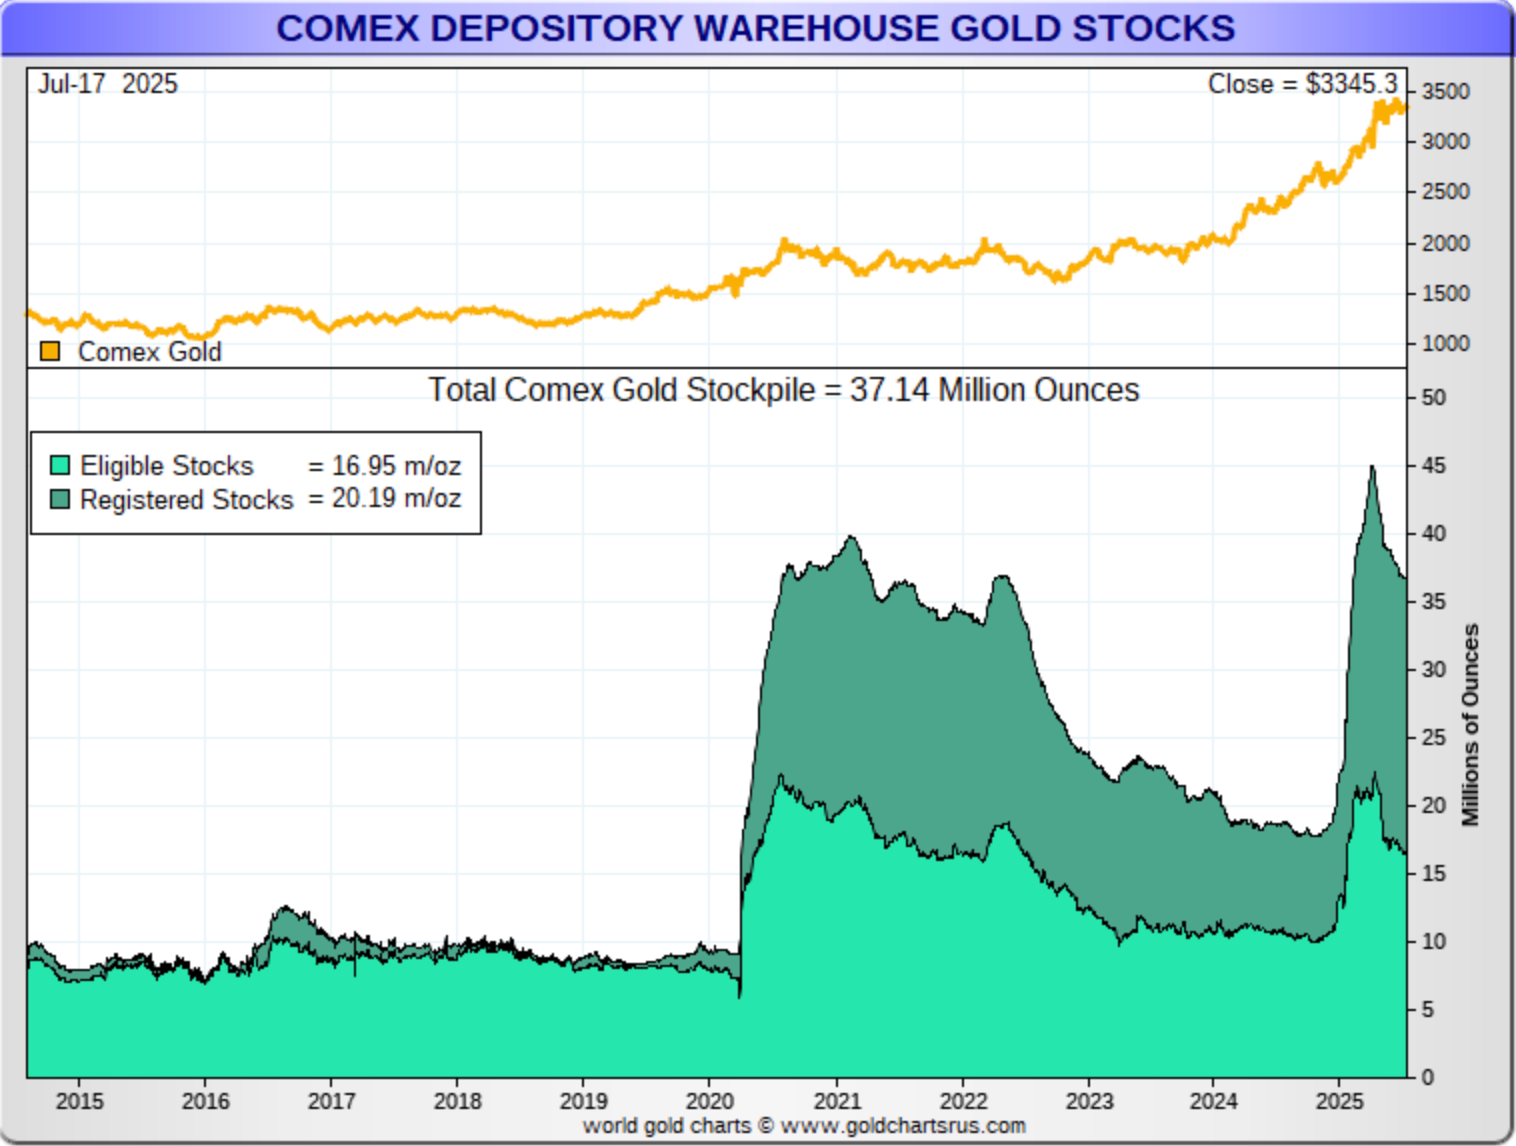
However, you can also see that gold has been leaving the COMEX since April.
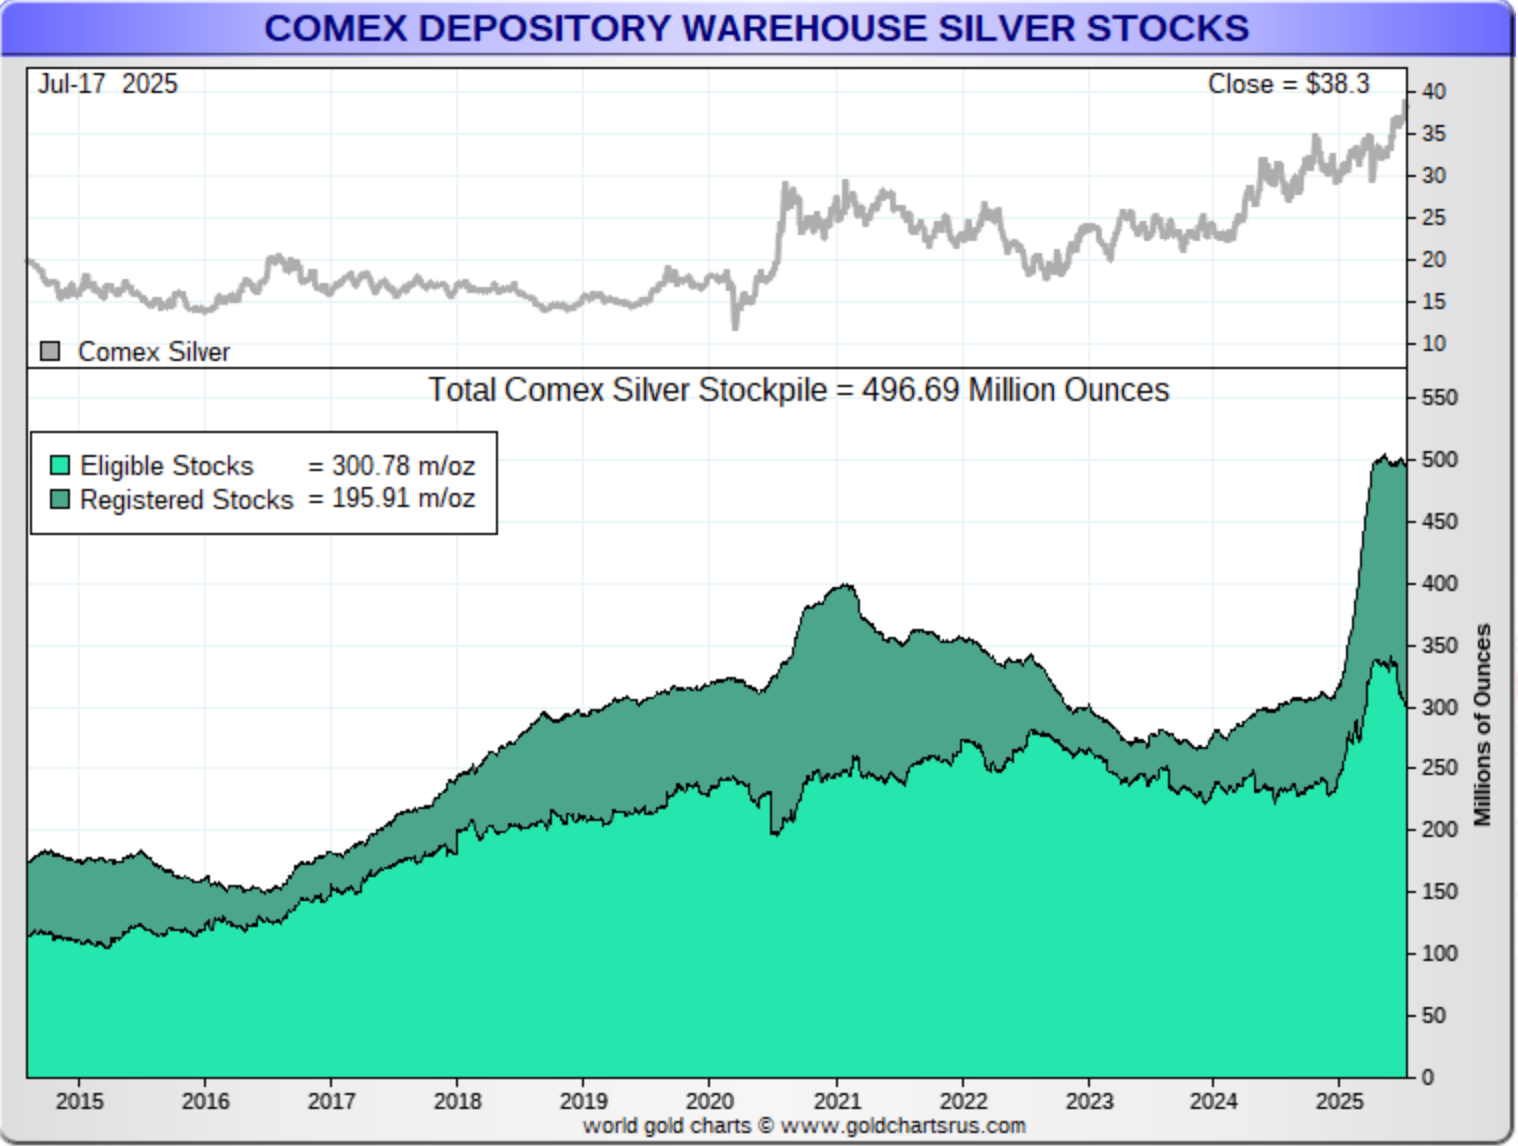
It’s a slightly different picture in silver, where metal did start leaving the COMEX vaults in 2021 and up until 2024 when silver started coming back in. Then there was the surge higher this year, although we haven’t seen the overall stockpile decrease over the past few months. Instead, we’ve seen metal flow from the eligible to registered category.
Looking at the LBMA vault holdings, the available free-float is down to 7,613 tonnes, which is 268.5 million ounces.
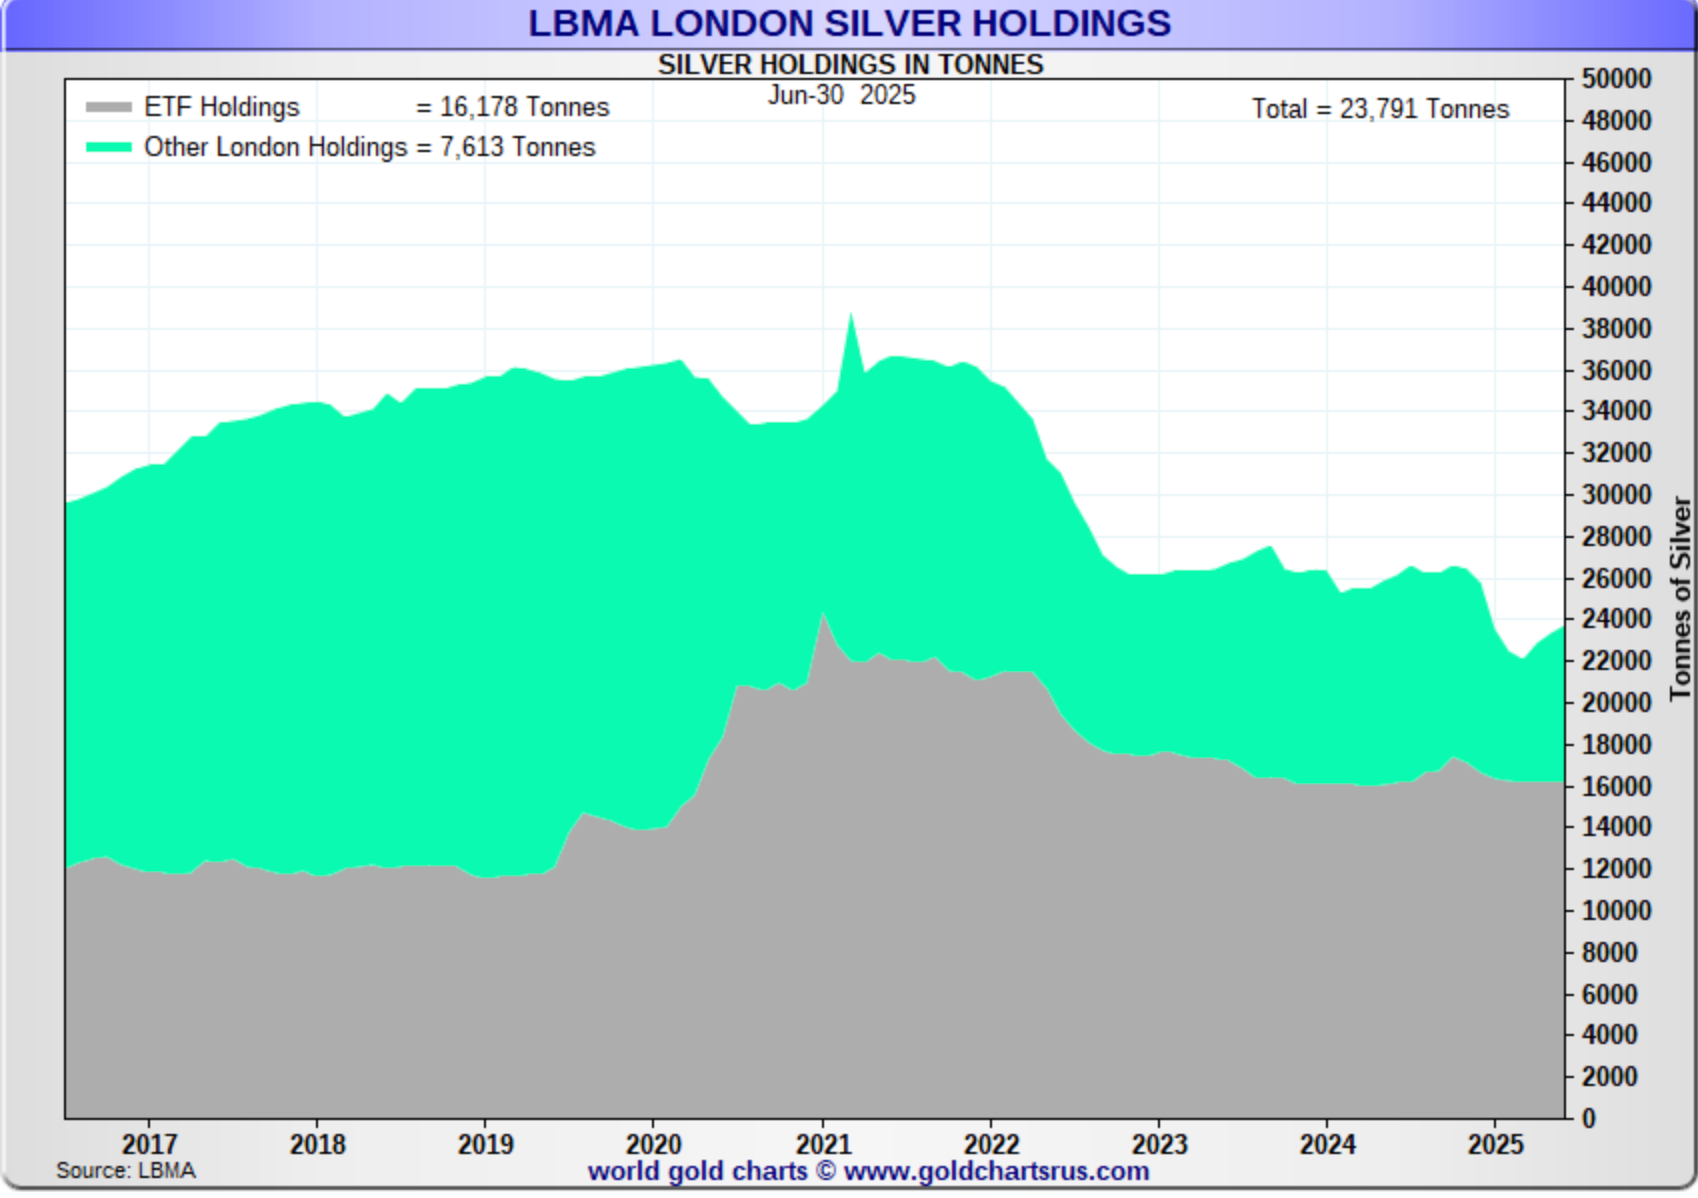
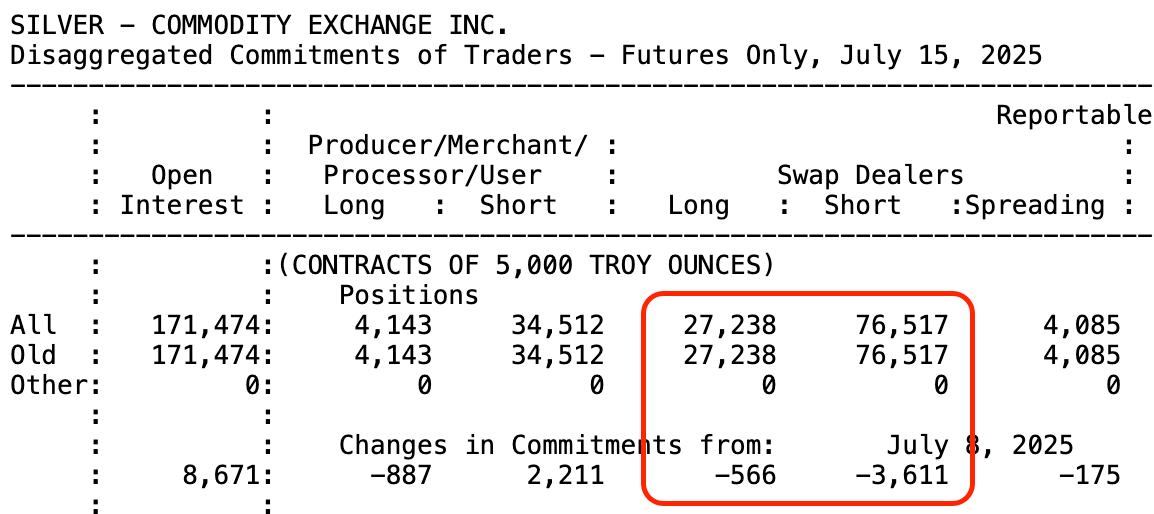
Although keep in mind that while the banks’ COMEX net short position was actually reduced over the reporting week due to the short-covering on Monday and Tuesday’s selloff, they’re still short 246.4 million ounces in New York.
Lastly, Michael DiRienzo of The Silver Institute, whom I greatly respect, and who I am also quite proud to call a great friend, recently did an interview on CNBC India, where he gave a great overview of what happened in the first half of 2025, as well as some things to watch out for in the second half.
So while silver may not have broken $40 this week, hopefully, a bit of a pause in the volatility has come as a welcome reprieve.
As always, I do hope you have a wonderful and healthy weekend, and I’ll see you back here on Monday.
More By This Author:
If You're Worried About The Fed's Independence, Consider What Paul Volcker Said About That
Is Silver Performing Better Against Gold Than You Realized?
Gold & Silver Selloff Continues After CPI Predictably Comes In Hotter Than Last Month


