Gold & Silver Are Consolidating Ahead Of The U.S. Presidential Election
Image Source: Unsplash
Gold and silver trading remained subdued this past week, with traders holding back from significant moves as they await the upcoming U.S. presidential election.
With only seven trading days left until the U.S. presidential election, financial markets have become quiet as they anticipate the outcome. In this environment, traders are hesitant to make large bets, often resulting in slowed, range-bound trading until the results are announced.
This behavior, known as a "volatility squeeze," has been particularly evident in gold and silver over the past week. The encouraging news is that gold and silver are poised to resume their upward trends soon, once they break out of their consolidation ranges.
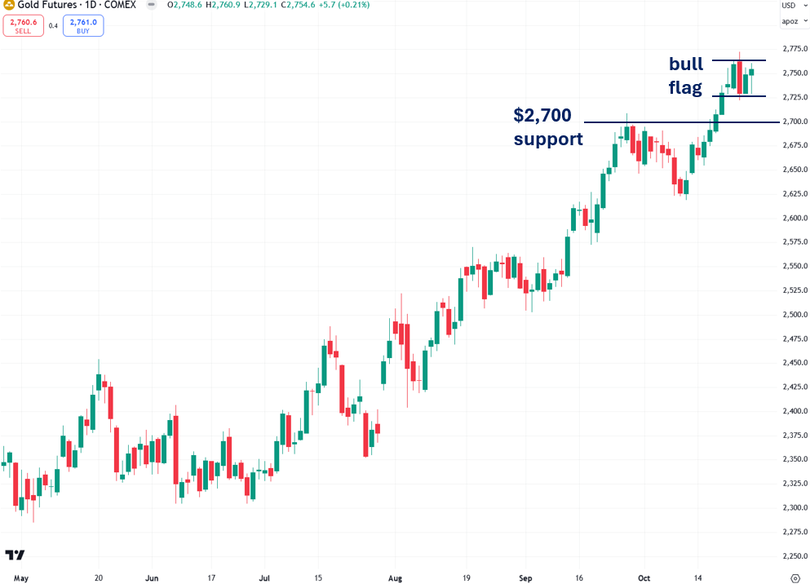
Gold has performed so steadily over the past few months that its orderly ascent has almost become predictable—talk about a good problem to have! COMEX gold futures recently closed above the critical $2,700 level, issuing yet another bullish technical signal.
Over the past week, gold has traded sideways and now sits just $18 shy of its all-time high reached on Wednesday. Interestingly, gold’s consolidation over the past week is forming what looks like a bull flag—a continuation pattern that suggests further gains once gold breaks out on strong volume.
Now, we're just waiting for the breakout, which could be triggered by the U.S. presidential election results or potentially even sooner. I anticipate gold reaching $3,000 fairly soon—a gain of just 9.2% from its current level.
(Click on image to enlarge)
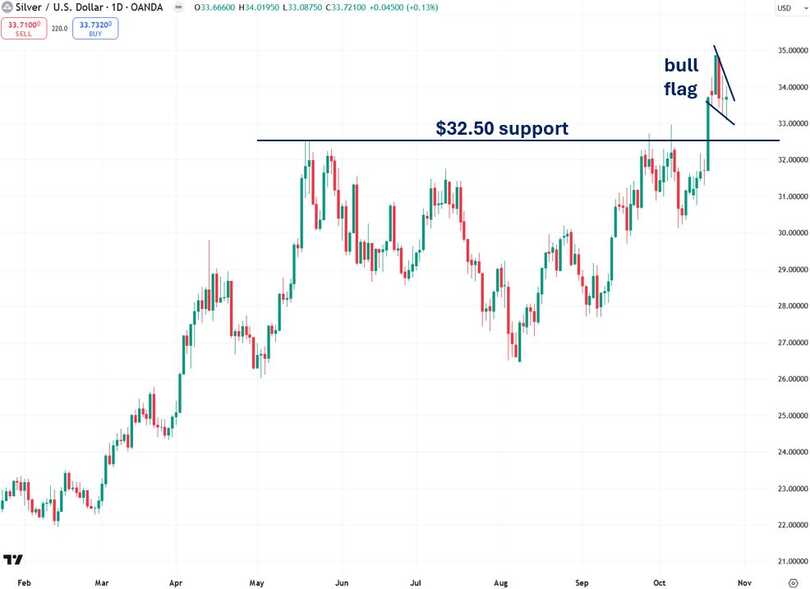
Similar to gold, silver also seems to be forming a bull flag pattern following its strong breakout above the critical $32.50 level on Friday, October 18th.
As I stated after that breakout, silver is on the verge of a powerful bull run that should push it to roughly $50 quite quickly. I stand by this outlook—the recent pause over the past week doesn’t diminish that potential at all.
I’ve noticed some people grow frustrated and impatient toward silver this past week, but it’s essential to remember that any asset is bound to take a breather after a hefty 15% surge in just a few weeks. As long as silver holds above the critical $32.50 support level, its breakout remains intact—we're simply waiting for it to push past the bull flag pattern.
(Click on image to enlarge)
When it comes to which political party is best for gold and silver, there’s no straightforward answer. It’s not as simple as "Democrats are good for precious metals, Republicans are bad," or vice versa.
As the World Gold Council points out, “Elections have not, historically, had a significant or immediate effect on gold's performance…”
Meanwhile, both parties have shown a knack for increasing national debt, making either outcome generally favorable for precious metals. It’s also worth noting that gold and silver have surged over the past month as Donald Trump’s election odds have significantly improved.
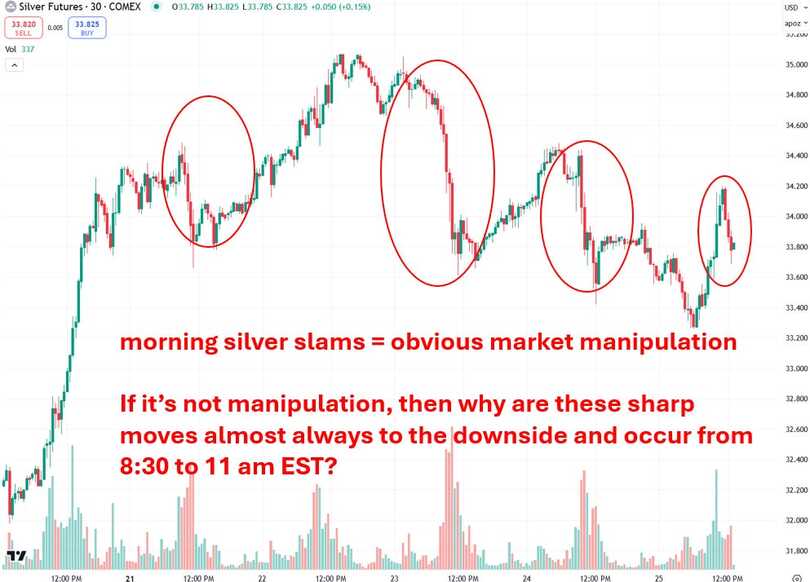
On a related note from last week’s trading, I wanted to share an observation that many of us in the industry have observed for quite some time: on a significant percentage of trading days, typically between 8:30 and 11 a.m. EST, silver—and, to a lesser extent, gold—often experience sudden, sharp declines.
The day often begins positively, with silver up nicely, but once the U.S. trading session opens, silver can get hit so hard and abruptly that it will make your head spin. One moment, it’s up—you step away to grab a coffee, and when you return, it’s plunged! I’m speaking from ample experience here.
This pattern frequently unfolds without any news catalyst, leading me to believe it’s evidence of market manipulation by the U.S. Federal Reserve via bullion banks aiming to suppress silver prices to strengthen the dollar’s comparative appeal.
I call it manipulation because of its consistently one-sided nature—almost always driving prices down rather than up, almost always at the same time each morning. This pattern appeared in four out of five trading sessions last week, which I believe is the banking cartel’s attempt to hold silver back following its recent breakout:
(Click on image to enlarge)
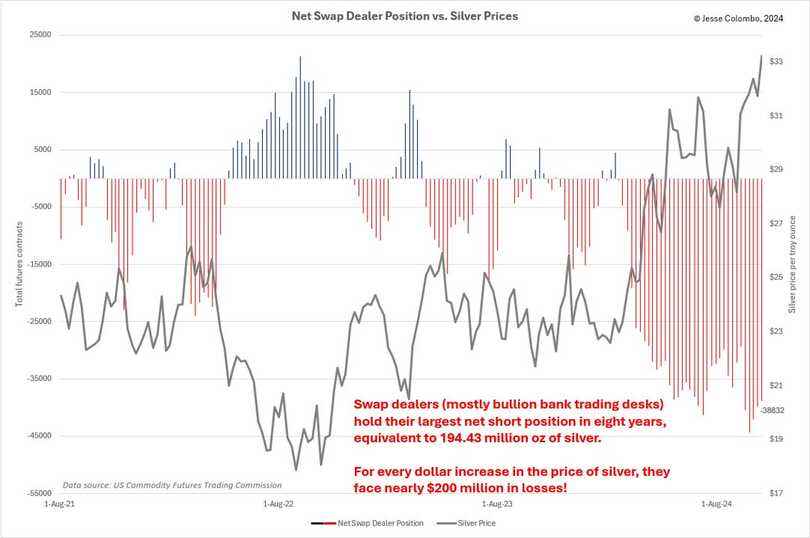
Since March, silver has risen over 50%, yet bullion banks have made considerable efforts to suppress its climb by flooding the market with a substantial amount of "paper" silver—equivalent to 194.43 million ounces.
The chart below highlights the sizable silver futures short position they’ve accumulated since March, illustrating the scale of this effort:
(Click on image to enlarge)
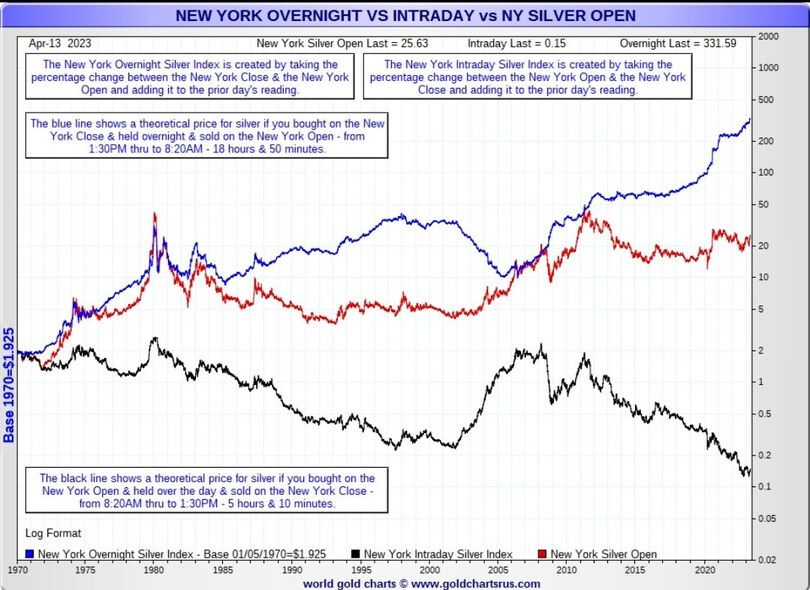
While some in the financial world deny silver manipulation, data from GoldChartsRUs provides compelling evidence to the contrary. Their New York Overnight vs. Intraday vs. New York Silver Open data and charts offer a statistical view of silver's downward manipulation.
The black line in the chart below represents the theoretical price of silver if bought at the New York open and held through the day until sold at the close, showing a clear downward trend over time.
The blue line represents the New York Overnight Silver Index, calculated by taking the percentage change between the New York close and the following New York open, adding it to the previous day’s value—demonstrating an upward trend.
The red line shows the standard spot price of silver for baseline comparison.
In summary, this chart illustrates that silver prices tend to rise during Asian and European trading hours but are consistently driven down during U.S. trading hours. Interesting.
(Click on image to enlarge)
More By This Author:
De-Dollarization: The Spirit Is Willing, The BRICS Is Still Weak
Why Did The Price Of Palladium Suddenly Spike?
De-Dollarization: Major International Bank Joins Chinese Payment Global System


