
Fed To Cut Rates, Dow 50,000 But Bumpy First, Buying Silver & Gold

Image Source: Unsplash
Today the FOMC concludes its meeting where they will cut interest rates by 1/4%. The stock market model is plus or minus 0.50% until 2pm and then a rally. With stocks at all-time highs and having rallied so smartly into the meeting, the success rate for a final two hour rally declines and the odds increase for a possible bout of mild weakness over the coming days.
In your world, Fed action immediately impacts the Prime Lending Rate. More slowly, credit card and auto loan rates will come down along with money market and CD rates. In other words, it’s a win for borrowers and a loss for lenders. Contrary to popular belief, fixed rate mortgages are absolutely not impacted by Fed rate cuts or hikes.
As I have written since 2025 began, the Fed is behind the curve and should have cut rates in March and June at a minimum. They have been worried about a fight long over, inflation. 2% is an arbitrary number. Ben Bernanke himself said the only reason it was 2% was that it’s far enough away from 0% where deflation would be worse. There no data-driven studies that support any given acceptable inflation number for the Fed to target. Jay Powell and Company have been dead wrong, yet again.
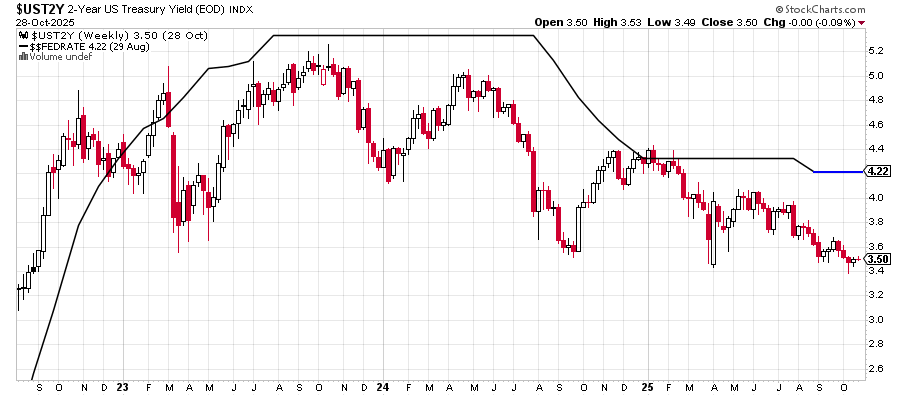
Let’s turn to my favorite chart for the direction of Fed-driven interest rates, which was inspired by my friend, Tom McClellan of Oscillator fame. You will see the Federal Funds Rate in black with my blue extension. The red and white lines are the 2-Year Treasury, which is what the Fed follows in essence. Right now, the market is telling the Fed that they need to cut 3/4% from the Fed Funds rate to get back to neutral from their current restrictive stance. And I continue to look for another two rate cuts in 2025, including today.
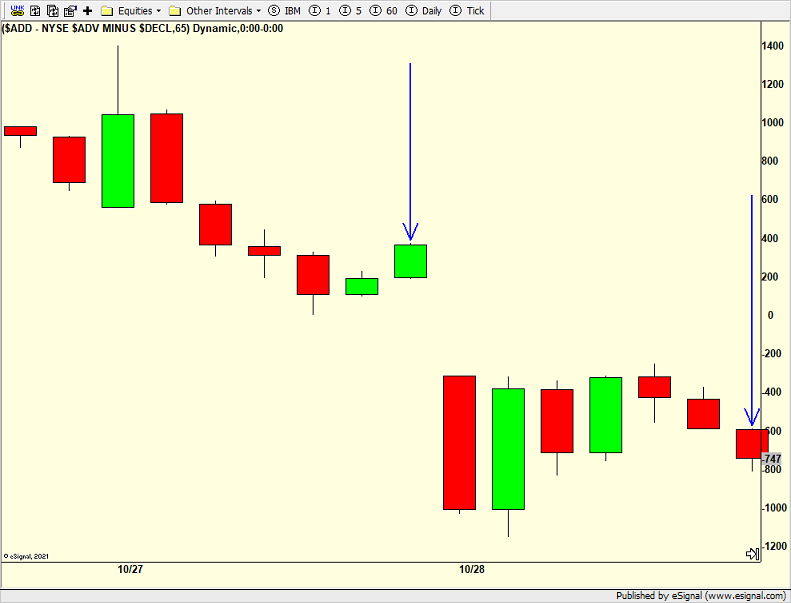
Moving on to the stock market, where my 2022 generated upside target of Dow 50,000 gets closer and closer, we do have a short-term problem although cutting rates at new highs does have bullish implications over the intermediate-term. While I remain of the forecast that 50,000 is reached in Q1 2026, the ride may get a little bumpier here. First, let’s look at the net number of stocks rising on the last two days when the S&P 500 soared to new highs. The two arrows show you +400 and -747. Given the magnitude of the last two days, both of those numbers should have been +1000. This shows less and less participation on those two days, clearly a warning sign, but not a “sell it all” sign.
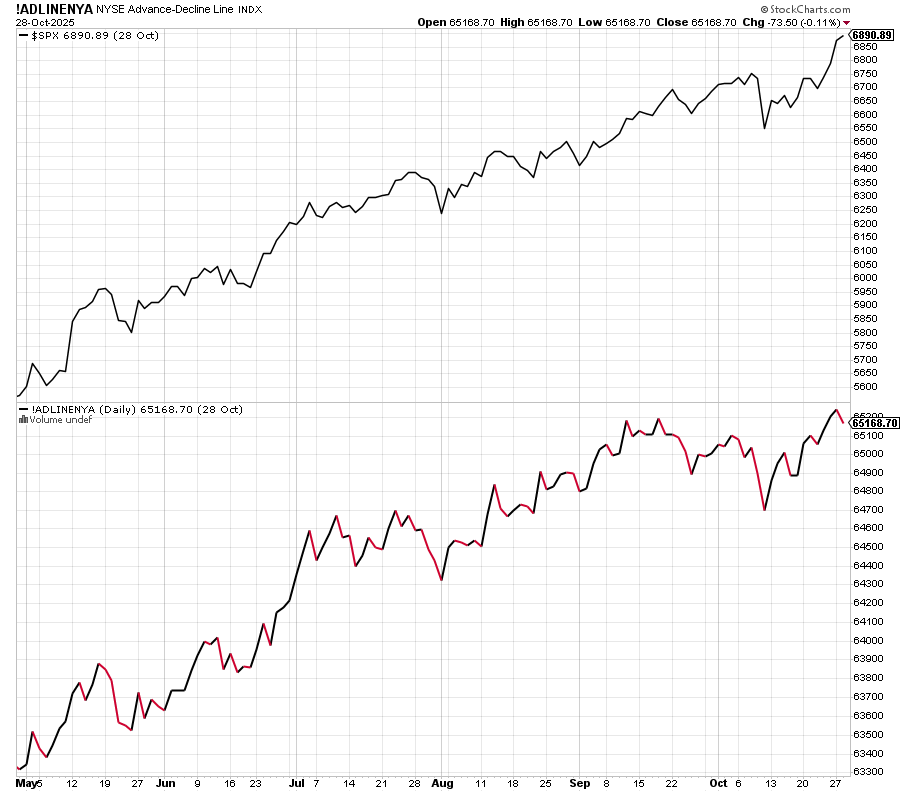
Now, before I get the usual Chicken Little emails about a bear market or repeat of 2008, let’s look at a longer-term view of market participation, the NYSE Advance/Decline Line, which adds the daily numbers shown above each day to a cumulative line.
Notice a difference?
The NYSE A/D is making fresh, all-time highs, which basically insulates against a bear market and large declines. It’s not perfect, but it’s pretty good.
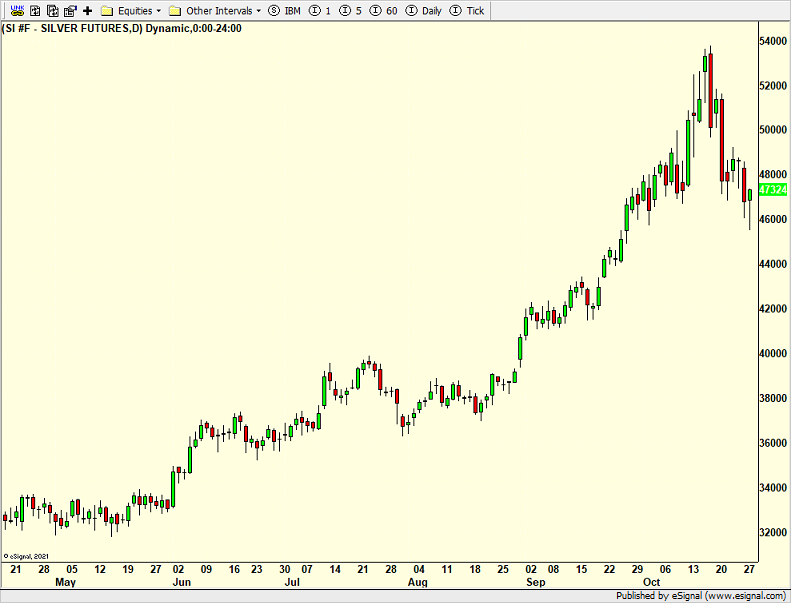
Finally, I have been pounding the table of an impending plunge in gold and silver to punish the latecomers. I have written about it for two weeks. Well, the first decline came right on schedule. Silver is below, and it has been hit for a quick 15% plunge from high to low. It is now in a position, along with gold to bounce at a minimum. What I like best about these trades is that your risk is clearly and easily defined. If gold or silver closes below Tuesday’s low, I am wrong and will get out.
On Monday, we sold BX. On Tuesday, we bought SDS. We sold NKE.
More By This Author:
Uncertainty Ahead? Active Management For Your Retirement Portfolio In Today’s Market
Punishing Gold & Silver Late Comers
Private Credit & Contagion Risk The Culprit
Disclosure: Please see HC's full disclosure here.


