
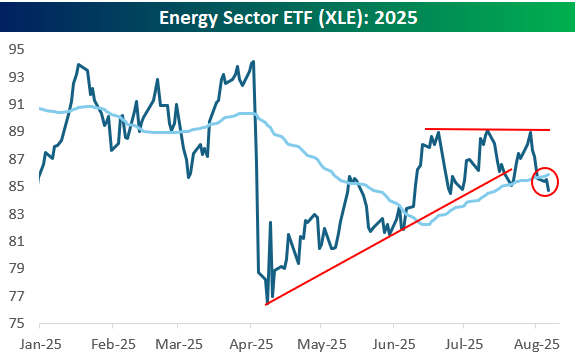
While some sectors like Tech (XLK) and Consumer Discretionary (XLY) are rallying sharply today, Energy (XLE) is going in the opposite direction with a decline of 1%.
The chart for the Energy sector doesn't look so hot. As shown below, XLE recently made a triple top just below resistance from the Q1 highs, broke below the bottom of its uptrend channel, and now it's back below its 50-day moving average.
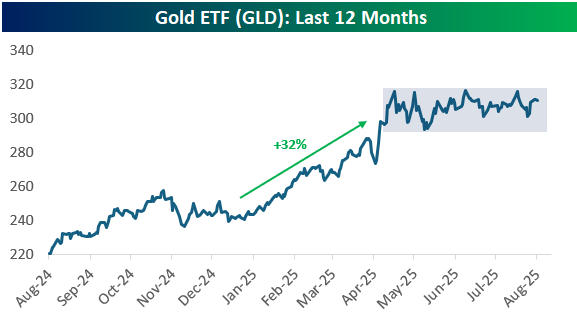
Another chart we thought looked interesting was the gold ETF (GLD). After a huge rally in the first few months of 2025, GLD has stalled out since early April. This looks like a classic "consolidation" pattern after a big move higher.
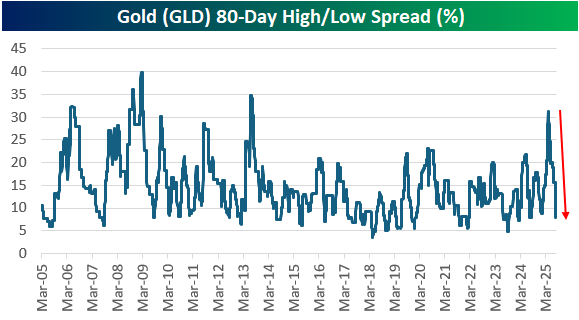
Below is a chart that shows the percentage spread between GLD's highest and lowest daily closing price over the last 80 trading days. After spiking to its highest level since 2013 earlier in the year, the spread has tumbled back below 10%.
Gold has finally taken a breather after a massive move. At some point, it will break out of this sideways range and either start another leg higher or start breaking down.
More By This Author:
Best And Worst Historical S&P 500 August PerformersJobs Day In Four Charts
Key ETF Asset Class Performance


Comments
Log in or sign up to join the conversation.