
Doctor Copper Warns Of Slowing Growth
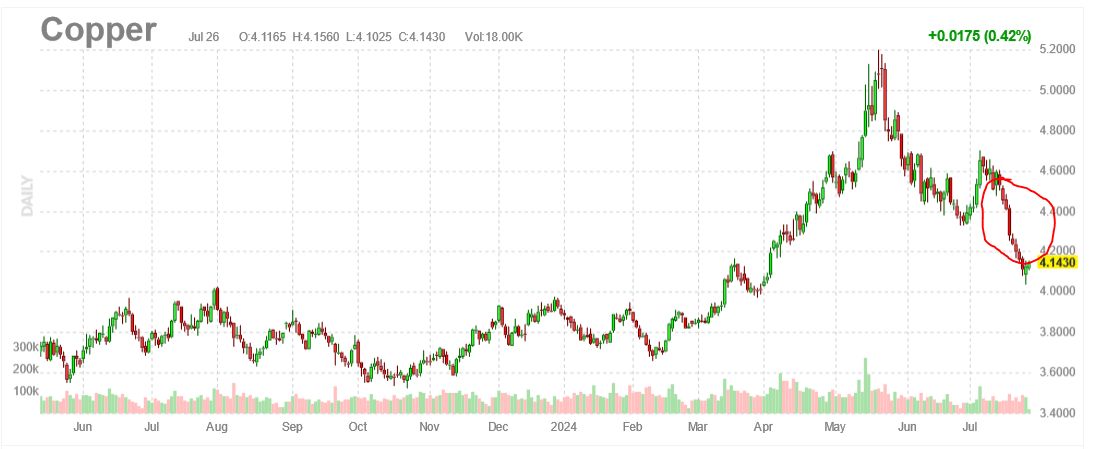
Copper is often called Doctor Copper as its price serves as an economic barometer. Before Friday, Doctor Copper was down for nine consecutive days. In the first five months of the year, copper prices rose by 38% as inflation stagnated, worrying the Fed that it could start a new upward trend. In reaction to stubborn inflation and a robust labor market, the Fed and markets sharply reduced their easing forecasts for the year. The market, economy, and Doctor Copper were on the same page. There would be no recession in 2024.
Over the last few months, inflation has resumed its downward trend. Equally important, the unemployment rate has risen by half a percent. As the economy started showing signs of slowing and the market began pricing in more rate cuts, Doctor Copper sprung a leak. Since peaking in mid-May, it has given up most of its 2024 gains. The losses are not only due to anticipation of a cooling economy but also a sharp decline in the demand for copper, as seen by rapidly rising inventories. Per the Kobeissi Letter:
Over the last 10 weeks, copper prices have dropped by 21% to their lowest level since April 1st, officially entering a bear market. This sharp turnaround comes after total global exchange inventories have skyrocketed. Inventory levels jumped from ~220,000 metric tons in Q1 2024 to ~580,000 currently, the highest level since Q2 2020.
What To Watch Today
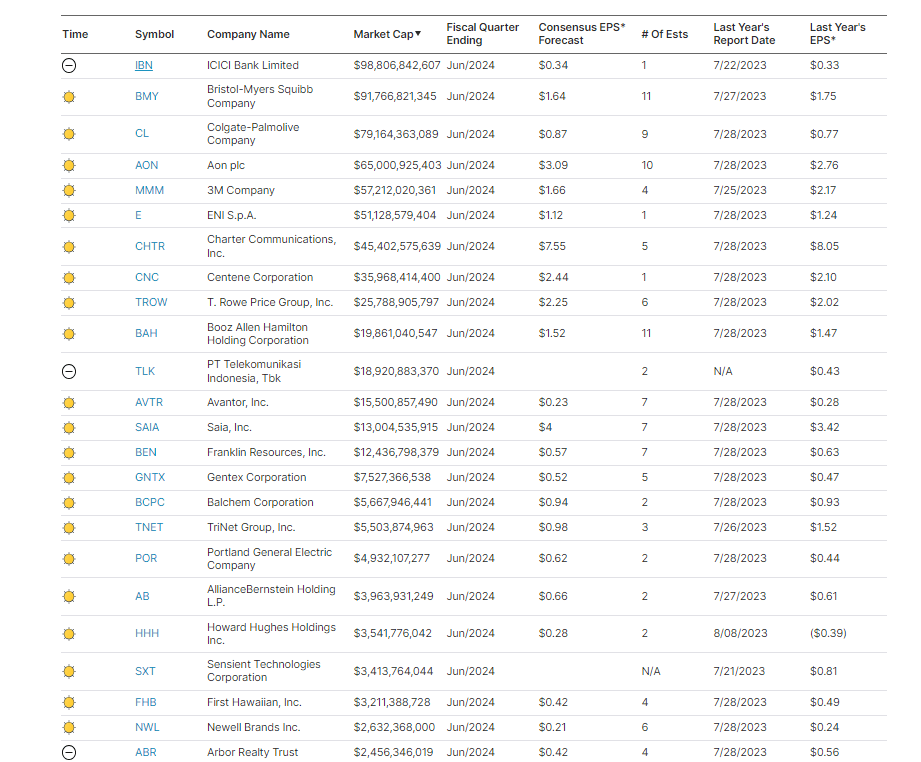
Earnings
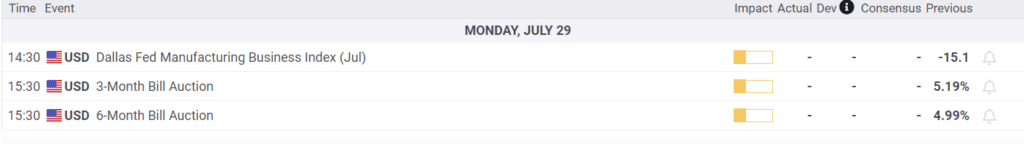
Economy
Market Trading Update
This past week, that pullback continued with the market breaking through the 20-DMA and testing the 50-DMA on Thursday. As we noted in Friday’s Daily Market Commentary:
“Whenever there is a market decline, we humans must try to rationalize the “chaos” by assigning a reason to it. The most recent rationalization is that the “AI trade” is dead. As noted by the better-than-expected revenue and earnings from Google (GOOG), most earnings growth comes from the largest companies. As such, we seriously doubt that managers will abandon these companies anytime soon. Furthermore, given that hedge funds need to move large amounts of capital at a time, these large-cap companies are the only companies that provide the needed liquidity.
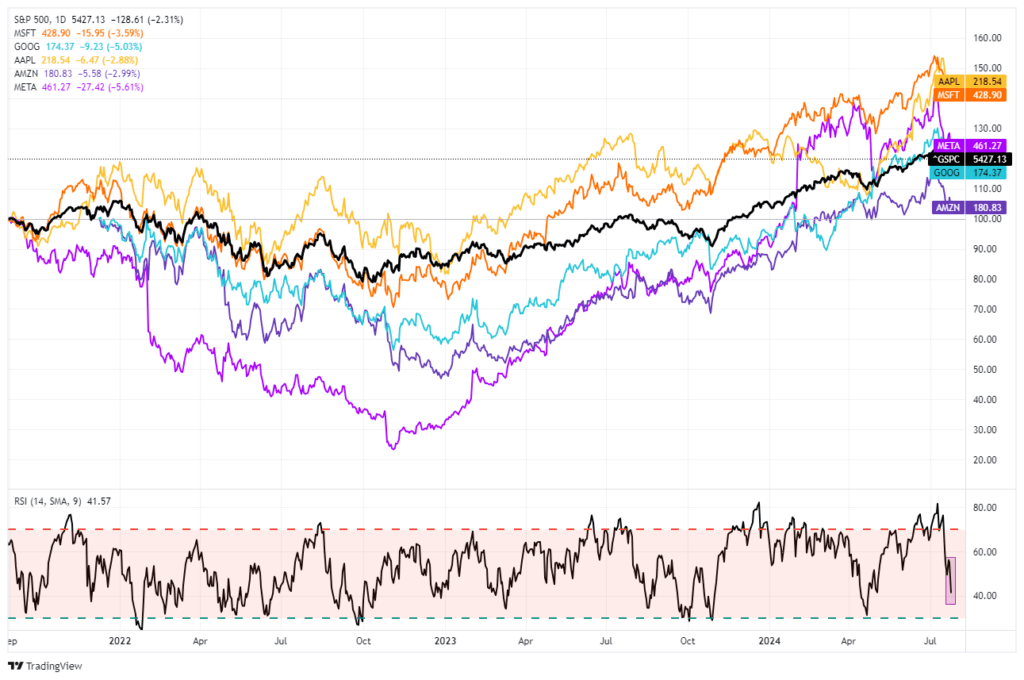
However, every time these “Mega-Cap” companies pull back, the media assigns a new rationale for why it is happening. The reality is that these companies have posted stellar returns this year, and a bit of profit-taking is unsurprising, just as we have seen at each previous market peak over the last two years. The chart below compares the darlings of the “AI trade,” Apple (AAPL), Microsoft (MSFT), Google (GOOG), and Amazon (AMZN) to the S&P 500 index. (I would have included NVDA, but it has rallied so much that it skews the chart too much.)
When the S&P 500 index advances or declines, there is a high price correlation with the “Mega-Cap” stocks. That correlation should be unsurprising because they make up ~35% of the index. The crucial point is that the current correction is likely just like every other correction we have seen over the last few years. It is highly likely that when this current corrective process concludes, large-cap stocks will once again resume their leadership.“
(Click on image to enlarge)
On Friday, the market reclaimed and held the 50-DMA with an encouraging broad market rally. However, while the markets are oversold enough for a reflexive bounce, the current correction process is likely incomplete. Moreover, the MACD “sell signal” also suggests that the current upside remains limited.
(Click on image to enlarge)
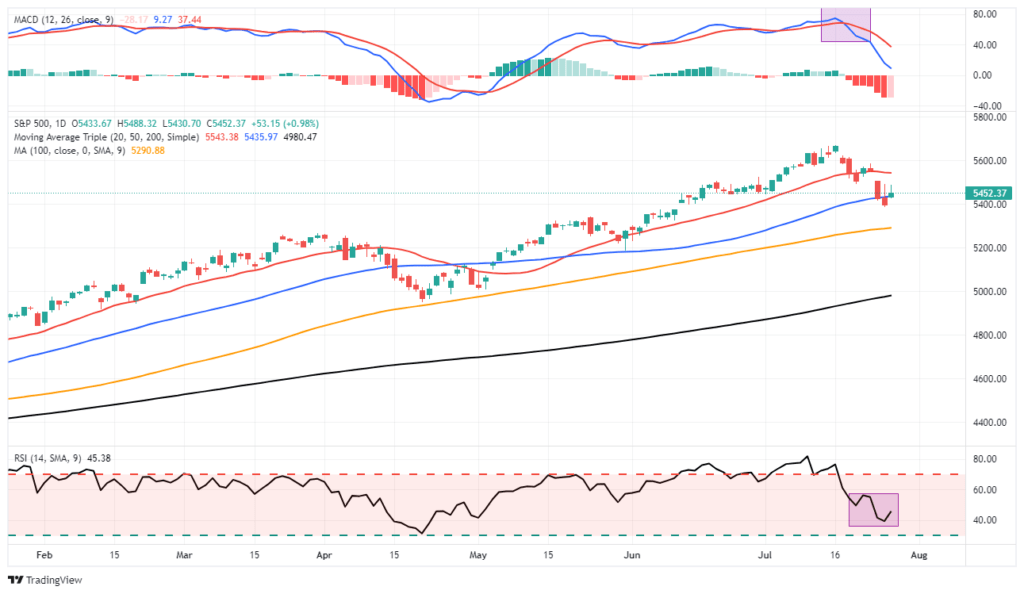
For now, use rallies to rebalance portfolios and reduce risk as needed. Our only concern is that with investors remaining very bullish despite the recent pullback, a further correction is required to resolve that condition.
The Week Ahead
The market will have a lot of data for investors to digest this week. Some of the largest market cap stocks will report earnings. Given the recent volatility in tech and mega-cap stocks, these reports could stir the markets. On Tuesday, MSFT and AMD report. META follows on Wednesday, with AAPL and AMZN on Thursday. Many other large corporations, such as XOM, MA, and PG, will also report.
The FOMC announcement is also on the docket this week. While Doctor Copper and other economic indicators point to a weakening economic trend, it is doubtful the Fed will cut rates. Instead, they will likely open the door for a September rate cut.
Lastly, the BLS and ADP will update us on the labor markets. The consensus for Friday’s BLS report is for a gain of 185k jobs, with the unemployment rate stable at 4.1%. Also, the ISM Manufacturing survey on Thursday is expected to remain in economically contractionary territory at 48.5.
PCE Prices Point To A September Rate Cut
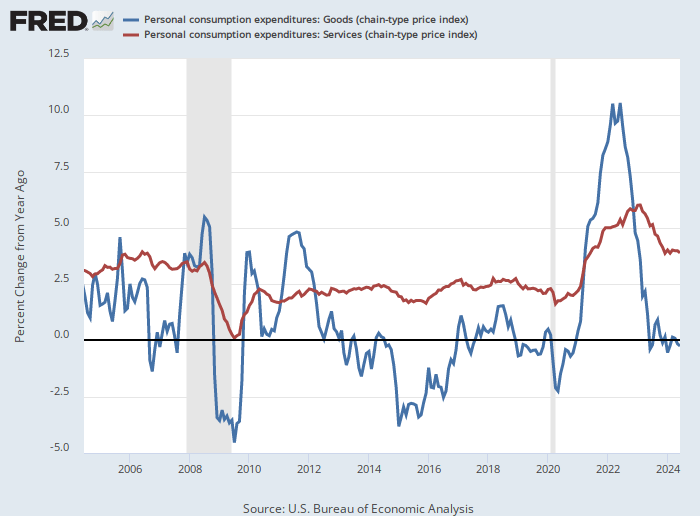
The monthly June PCE price index aligned with expectations, rising 0.08% m/m. Importantly, it affirms the string of slowing price data we have seen over the past few months. Services inflation continues to report higher inflation than goods. This past month, it contributed 0.14% to monthly PCE. Accordingly, goods prices fell slightly. The chart below shows the history of inflation in goods and services.
Core PCE was slightly higher than expectations at 0.18% versus 0.15%. Also, personal incomes, which feed inflation, were 0.2% below expectations at +0.2%. The market odds of a September rate cut were unchanged on the data. Currently, the odds are 110% for a cut in September. In other words, 25bps is fully priced in, with small odds of a 50bps cut.
Tweet of the Day

More By This Author:
Market Correction Doesn't Deter Investor Bullishness
Is The Market Decline And Rotation Due To The Yen?
Overly Optimistic Investors Face Potential Disappointment
Disclaimer: Click here to read the full disclaimer.


