Crude Oil Update: OPEC+ Output Cut Signals Price Floor Intentions, Brent Unchanged For Now
Brent crude oil found support yesterday post-OPEC+ but swiftly retraced soon after as the U.S. dollar remained buoyant. Today, brent is trading marginally higher echoing a slightly weaker greenback. OPEC+ announced that they will be cutting output by 100Mbbls/d come October signaling to the market that elevated crude oil prices are here to stay at least for the rest of 2022. Their reasoning behind the cut was aimed at addressing the recent spike in volatility as well as liquidity concerns but looking at historical outputs this year, we have noticed OPEC+ falling well short of their projected supply figures, rendering the recent cut largely insignificant – hence the sharp pullback in brent crude price action.
We have seen brent fall quite significantly from the highs in March this year and with recessionary fears intensifying, demand destruction is highly likely leaving little in the way of demand-side support for crude oil. That leaves OPEC+ with one option, supply manipulation and while this cut does little in the way of noteworthy changes, the intention is there as a warning that future larger cuts may be on the cards to avoid a substantial drop in crude oil price. This being said, should a recession grip the global economy, output cuts will just enhance the recessionary effect and drive economies lower. From a supply-side perspective, an agreement between the U.S. and Iran could also bring additional supply to OPEC+ back online thus complicating matters even further. Overall, I expect the intended price floor by OPEC+ which markets believe is around the $90/barrel mark is unlikely to hold leaving crude oil exposed to the further downside over the next few months.
Economic Calendar
The economic calendar (see below) is fairly light today with U.S. ISM services PMI data under the spotlight. Being a predominantly service-driven economy, this data print is extremely important and should give us a good gauge to the health of the U.S. economy from a non-manufacturing reference point. The dollar will be in focus and a significant miss or beat could spark large moves in the DXY and thus crude oil as well (traditional inverse relationship).
Source: DailyFX Economic Calendar
Technical Analysis
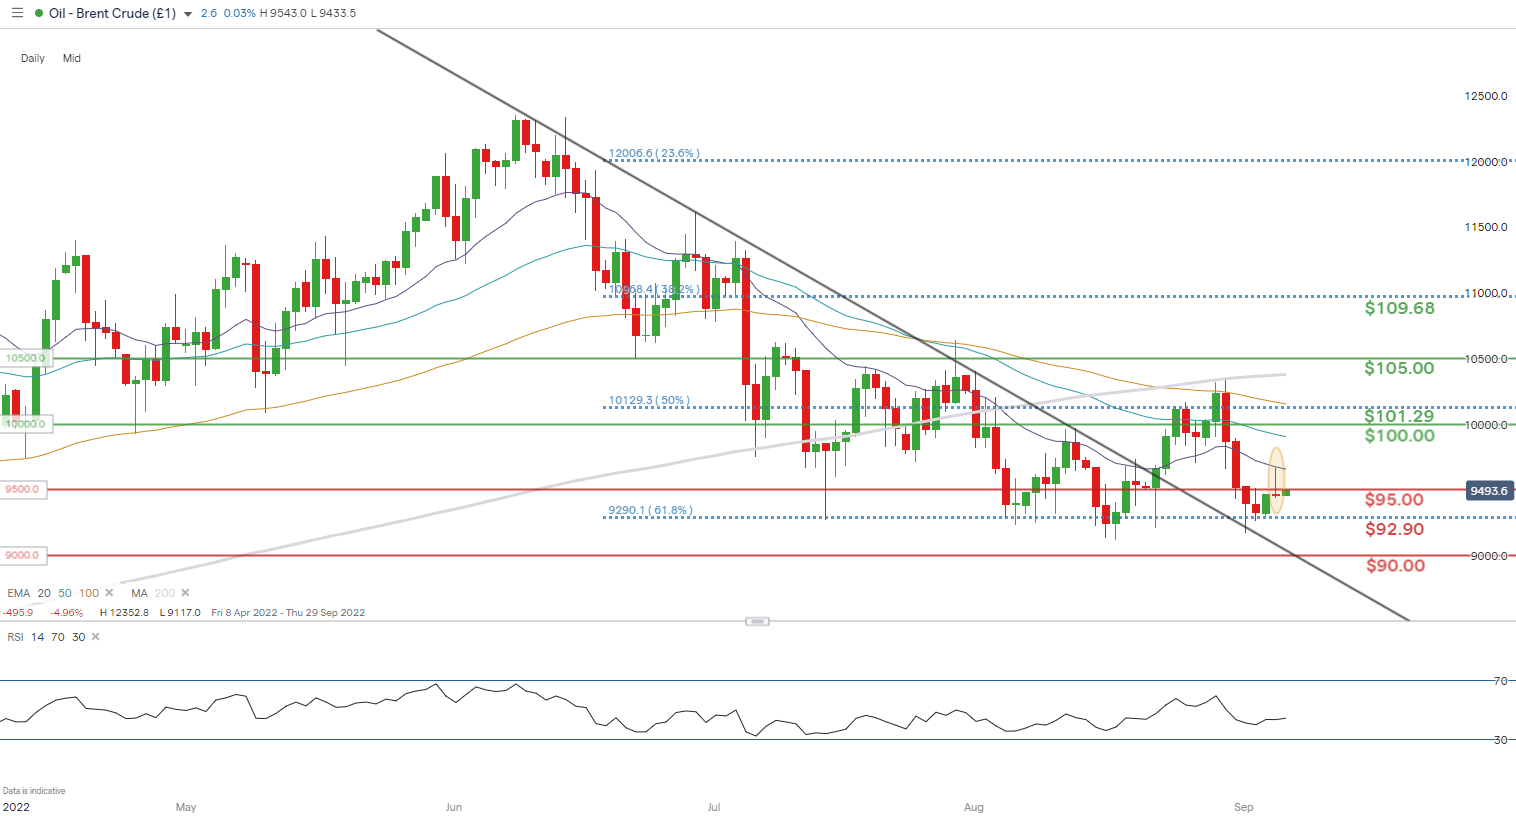
Brent Crude (LCOc1) Daily Chart
(Click on image to enlarge)

Chart prepared by Warren Venketas, IG
The daily brent crude chart (undated) above has bulls quietly holding its head above the 95.00 psychological resistance level. The key technical suggestion I want to point out is yesterday's extended upper long wick candle close (yellow) which theoretically indicates an impending downside. I think this is a reasonable assumption as the dollar shows no signs of letting up while demand destruction is weighing on crude oil prices. I will be looking for a retest of the 90.00 support zone in due course.
Key resistance levels:
Key support levels:
- 95.00
- 92.90 (61.8% Fibonacci)
- 90.00
IG Client Sentiment: Bearish
IGCS shows retail traders are NET LONG on Crude Oil, with 79% of traders currently holding long positions (as of this writing). At DailyFX we typically take a contrarian view to crowd sentiment resulting in a short-term downside bias.
More By This Author:
Euro Forecast: EUR/USD Below 99c And EUR/GBP Awaits New UK PM
AUD/USD Forecast: Aussie Dollar Fades As Headwinds Intensify Ahead Of RBA Rate Decision
S&P 500, Nasdaq 100 Forecast For Week Ahead: A Path Higher Is Difficult But Possible
Disclosure: See the full disclosure for DailyFX here.


