AUD/USD Forecast: Aussie Dollar Fades As Headwinds Intensify Ahead Of RBA Rate Decision
Australian Dollar Fundamental Backdrop
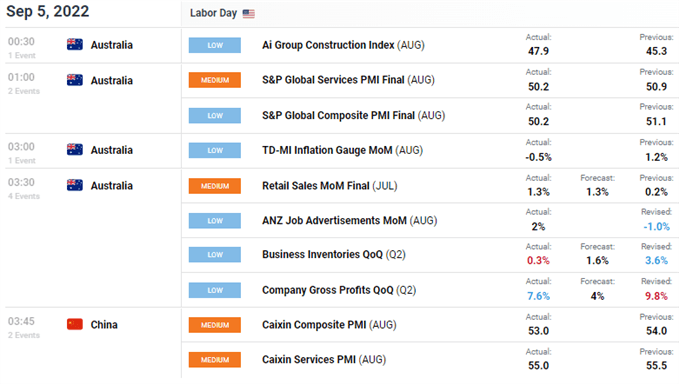
AUD/USD started the week off on the back foot starting with the Australian economic non-manufacturing PMI declining to 50.2 (see economic calendar below) - the lowest since January 2022. While this shows business activity marginally expanding, the decline since July has been largely caused by inflationary pressures on the consumer along with higher interest rates.
Economic Calendar
Source: DailyFX economic calendar
According to S&P Global Market Intelligence, firms are becoming increasingly concerned by persistently high inflation in their business in the fourth quarter of 2022. In contrast, retail sales data for July managed to meet expectations and increase from the previous print however, the lag in time gave little in the way of Aussie price appreciation. Tomorrow’s Reserve Bank of Australia (RBA) rate decision looks likely to result in a 50bps increase as money markets currently price this in with a 67% probability in attempts to quell inflation– see below. Looking ahead to October, the incremental increase shows a potentially less aggressive RBA as recessionary fears grip global markets as well as the ‘pro-growth’ Aussie. This being said, the hawkish message being distributed by the Federal Reserve keeps pressure on other central banks to maintain higher-than-desired interest rate hikes. Should we see a 50bps rate hike tomorrow, AUD may find some support short-term but the progressively fading fundamental backdrop for Australia leaves forward guidance skewed towards the greenback.
RBA Interest Rate Probabilities
Source: Refinitiv
From an external perspective, Chinese PMI data presented a similar drop as COVID-19 restrictions continue to plague the Chinese economy. Last week, we saw S&P Manufacturing PMI move into contractionary territory adding to AUD woes as this directly impacts demand for Australian commodity exports.
Finally, the USD extended its run higher after Friday’s glitzy jobs report negating concerns about a fading labor market. The US Dollar Index (DXY) pierced the 110.00 resistance zone earlier this morning for the first time since June 2002 showing no signs of letting up just yet.
Technical Analysis
AUD/USD Daily Chart
(Click on image to enlarge)

Chart prepared by Warren Venketas, IG
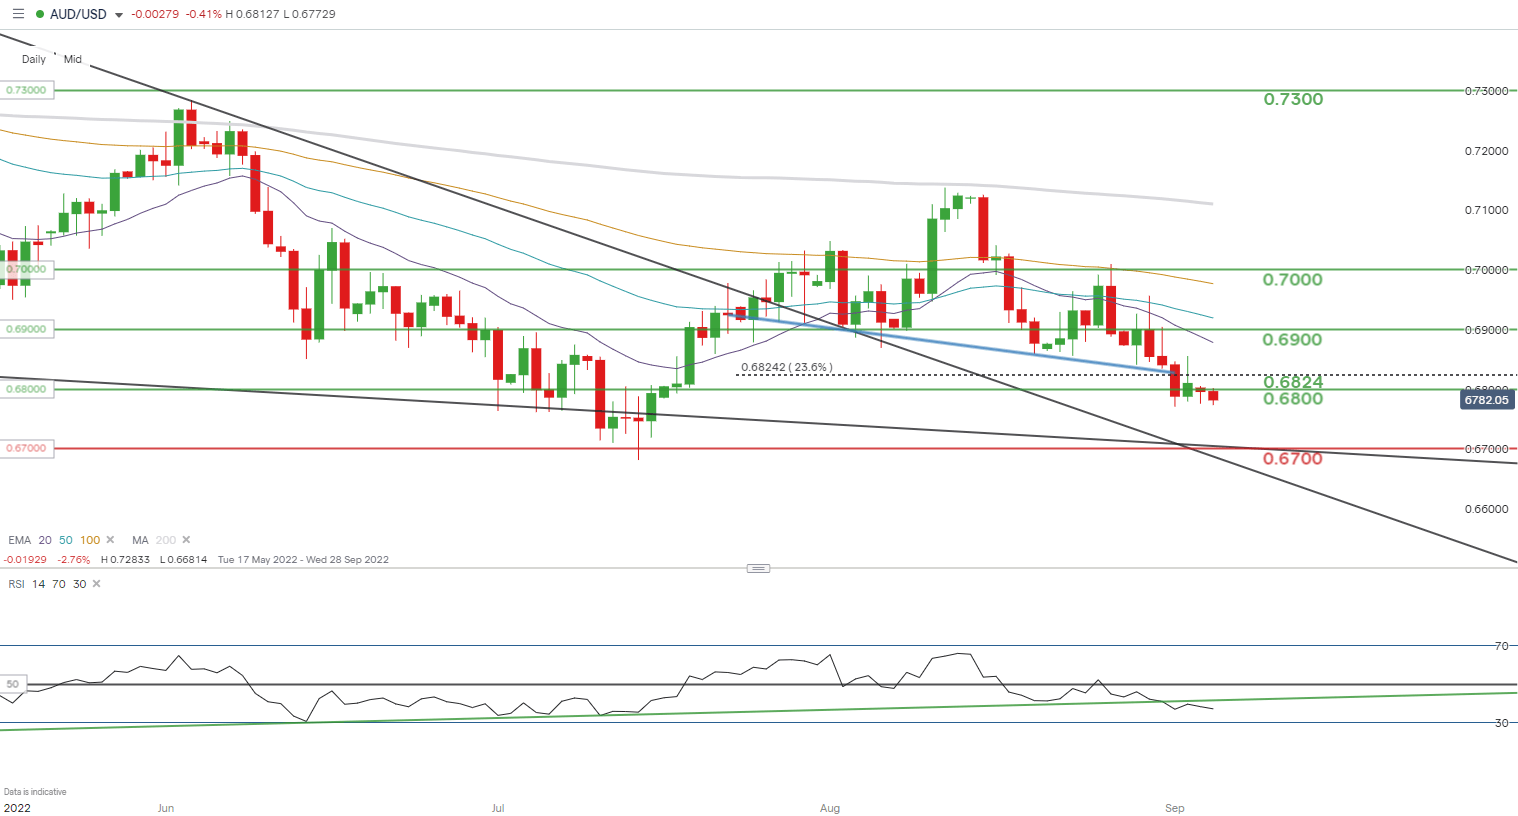
Last week’s analysis highlighted the potential head and shoulders chart pattern neckline (blue) break which has since taken place. The breakout coincides with a push below the Relative Strength Index (RSI) trendline support (green) and may bring into consideration the 0.6700 psychological level.
Key resistance levels:
- 0.6824 (23.6% Fibonacci)
- 0.6800
Key support levels:
- 0.6700
IG Client Sentiment Data: Bearish
IGCS shows retail traders are currently LONG on AUD/USD, with 71% of traders currently holding long positions. At DailyFX we typically take a contrarian view to crowd sentiment resulting in a short-term downside bias.
More By This Author:
S&P 500, Nasdaq 100 Forecast For Week Ahead: A Path Higher Is Difficult But PossibleGold Prices Set To Move Higher In The Week Ahead After NFP Data Cools FOMC Bets
USD Weekly Forecast: Solid Jobs Report Supportive Of U.S. Dollar And 75 Bps Rate Hike
Disclosure: See the full disclosure for DailyFX here.


