
Crude Oil Returns To Its Diving Lessons. CPI Hits New High
What are the main price drivers in crude oil to observe this week?
Oil tumbled on Tuesday, caught in a climate of anxiety over the possibility of a global recession, which would stifle demand, even if many signals continue to predict a tight market for a long time.
Central Banks’ Monetary Policies vs Recession Fears
The European Brent benchmark settled below $100 a barrel for the first time since April 2022 on a strengthening dollar. In a market that remains unbalanced, struggling for oil despite threats to demand, and as volatility grows in energy markets, there is a consensus among analysts to report the darkening outlook for the global economy. In the West, the combination of high energy prices and rising interest rates is fueling fears of a recession, which would have a serious impact on the black gold market.
About the Chinese Panda
A new wave of health restrictions in China is also worrying investors, raising fears of further shutdowns. There is a slowdown in demand from the world's largest crude oil importer and fears over what Friday's second quarter growth figures will reveal. The Chinese authorities seem once again to prefer sacrificing their economy in pursuit of draconian public health goals.
US Consumer Price Index (CPI) data
As highlighted in my last article published last week, here is a quick reminder that the US Consumer Price Index (CPI) data for the month of June will be released on Wednesday. What will it be in comparison to May figures? Traders will observe whether the peak of inflation is behind, or not yet. If it is lower, then we could see a certain sense of relief (a rather positive sentiment). This could possibly mean that the US Federal Reserve (Fed) may decide to not hike much. If not, then the volatility may increase on negative sentiment, with another peak on the Volatility (aka “Fear”) Index (VIX) causing a drop for markets (particularly equities) much lower, and consequently, the Fed may have to consider hiking rates further, etc.
VIX chart (before CPI data):
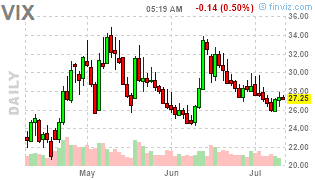
(Source: Futures Charts – Finviz.com)
As I am writing these lines, the CPI figures just came up through the following table:
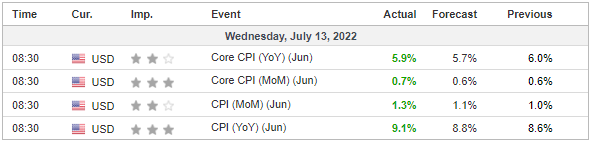
(Source: Economic Calendar – Investing.com)
As we can see, the actual numbers are all surpassing the expectations, and for most of them, they are even higher than the previously released data (except for the Core CPI (YoY), which is slightly lower than the previous release. U.S. inflation is thus intensifying by hitting a new 4-decade high of 9.1% in June! Therefore, we may start seeing volatility increase again.
(Source: Futures – Finviz.com)
VIX chart (less than 30min after CPI release):
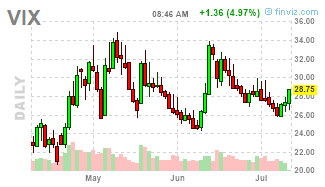
(Source: Futures Charts – Finviz.com)
Fundamental Analysis
On Tuesday, the American Petroleum Institute (API) released their weekly oil stock figures.
U.S. API Weekly Crude Oil Stock
Once again, the weekly commercial crude oil reserves in the United States rose to +4.762M barrels while the forecasted figure was just about -1.933M), according to figures released yesterday by the US American Petroleum Institute (API) (direct link under following chart).

US crude inventories have thus increased by another 4.762 million barrels, which firmly confirms slowing demand and could still be considered a bearish factor for crude oil prices. This figure may also signal a drop in fuel consumption, which could potentially be explained by some changes in consumer behavior, but also by the artificial and temporary Strategic Petroleum Reserve (SPR) release, as one reader brought to my attention through the comment section.
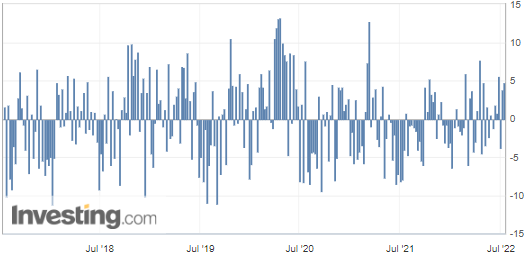
(Source: Investing.com)
We will see whether those figures will be confirmed by the U.S. Stocks of Crude Oil and Petroleum Products published later on by the Energy Information Administration (EIA).
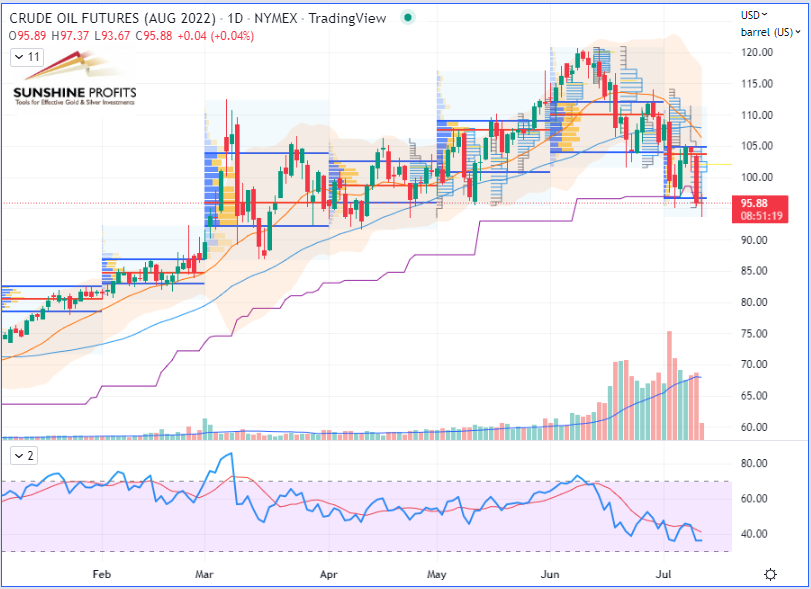
WTI Crude Oil (CLQ22) Futures (August contract, daily chart)
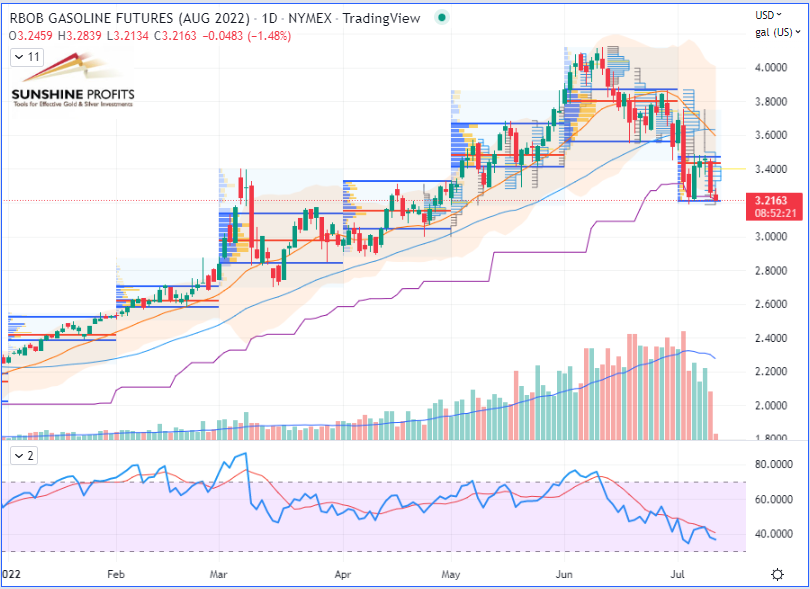
RBOB Gasoline (RBQ22) Futures (August contract, daily chart)
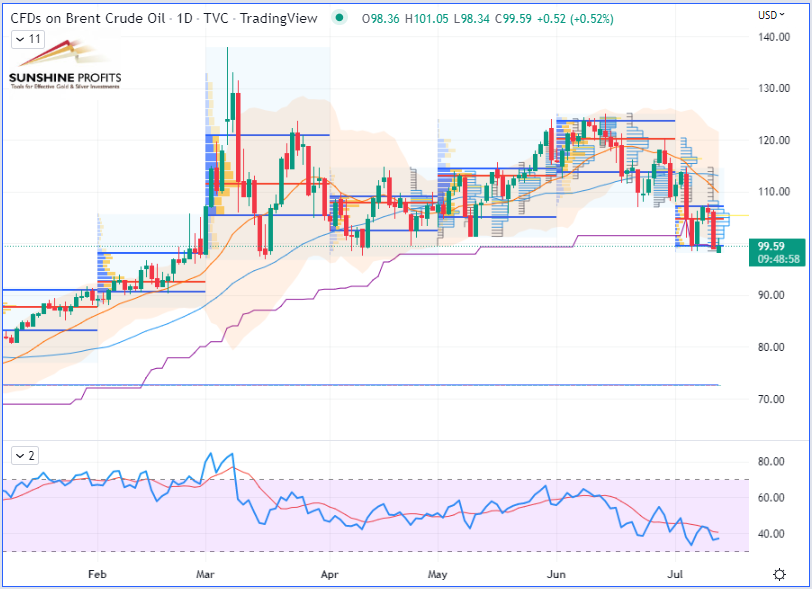
Brent Crude Oil (BRNQ22) Futures (August contract, daily chart) – Represented by its Contract for Difference (CFD) UKOIL
More By This Author:
Rebounding Crude Oil Gets Far Away From The Bearish Side
Is Crude Oil About to Pivot into Bearish Territory?
Are Interest Rate Hikes Bearish or Bullish for Oil Prices?
Disclaimer: All essays, research and information found in this article represent the analyses and opinions of Sunshine Profits' associates only. As such, it may prove wrong and be ...
more

