
Crude Oil Eyes API Data After Selloff Stalls On OPEC Deal Hopes
Crude oil price action seemed somewhat counter-intuitive yesterday. Prices launched higher after OPEC updated its 2017 market outlook to predict that output from outside the cartel will increase by 200k barrels, reversing a previous forecast that envisioned a drop of 150k barrels. One might have expected that the prospect of a supply increase would pressure prices lower, not send them upward.
A possible explanation may be that traders interpreted the announcement in the context of speculation that OPEC producers might agree to an output freeze at an informal meeting in Algiers this month. Traders may have reasoned that an accord is more likely if the group’s membership is growing more concerned about downside price pressure from outside their ranks.
Gold prices rebounded after touching a three-week low intraday after Fed Governor Lael Brainard struck a familiarly dovish tone in the last bit of commentary from policy officials before this month’s FOMC policy announcement. Markets were keen to see if Brainard would adjust her posture to fall in line with the recent hawkish rhetorical shift from most of her colleagues. The US Dollar declined alongside front-end bond yields after the Governor spoke.
Looking ahead, crude oil will look to the API weekly inventories estimate for direction. The report sent prices sharply higher last week. Gold may struggle to find lasting directional conviction amid a lull in Fed-linked news flow. The near-term bias may cautiously favor the upside as markets digest down-shift in the projected rate hike path following Governor Brainard’s commentary, but lasting follow-through may have to wait for US retail sales, inflation and consumer confidence data due later in the week.
Is picking price direction most important for successful trading? See our study to find out!
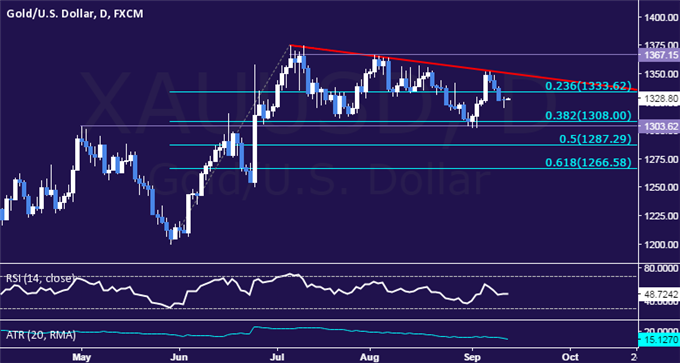
GOLD TECHNICAL ANALYSIS – Gold prices are treading water having retreated to a three-week low. A daily close below support in the 1303.62-08.00 area (May 2 high, 38.2% Fibonacci retracement) paves the way for a challenge of the 50% level at 1287.29. Alternatively, a move back above the 23.6% Fib at 1333.62 exposes falling trend line resistance at 1350.32.
CRUDE OIL TECHNICAL ANALYSIS – Crude oil prices paused to consolidate losses after signaling a possible top with the formation of a Bearish Engulfing candlestick pattern. Near-term support is now at 44.20, the 38.2% Fibonacci expansion, with a break below that on a daily closing basis exposing the 50% level at 42.73. Alternatively, a reversal back above the 23.6% Fib at 46.02 opens the door for a retest of falling trend line resistance, now at 47.53.

--- Written by Ilya Spivak, Currency Strategist for DailyFX.com
To receive Ilya's analysis directly via email, please SIGN UP HERE
Disclosure: - If you’re looking for trading ideas, more


It's becoming apparent that Saudi Arabia is thinking of curbing their increases not due to want but because it is getting impossible for them to drive them lower due to a limit on how much they can produce. This is a good sign and something I think people are beginning to realize. Saudi Arabia doesn't completely control the market and doesn't have infinite amounts of oil. In reality, they are going to have less production in 50 years from now, not more.