
CPI Key Reversal
Thursday's Key Reversal by the S&P 500 Index in an unusually large 150-point trading range after the release of the September Consumer Price Index data set off speculation as to the cause. Some thoughts follow.
First, the Minor Island Top identified last week quickly followed the script as it headed back down to test the low made on Friday, September 30, at 3584.13 and made a reversal attempt early Tuesday, but failed to hold the gain.
S&P 500 Index (SPX) 3583.07 declined 56.59 points or -1.55% last week after making wide trading range Key Reversal on Thursday then met the objective of a higher intraday high on Friday. Some analysts claim round-number support at 3500 as well as a 50% retracement from the January high played a role and may have triggered algo buying activity. The line on close chart below augmented by the lows and highs for both Thursday and Friday show the wide trading ranges.
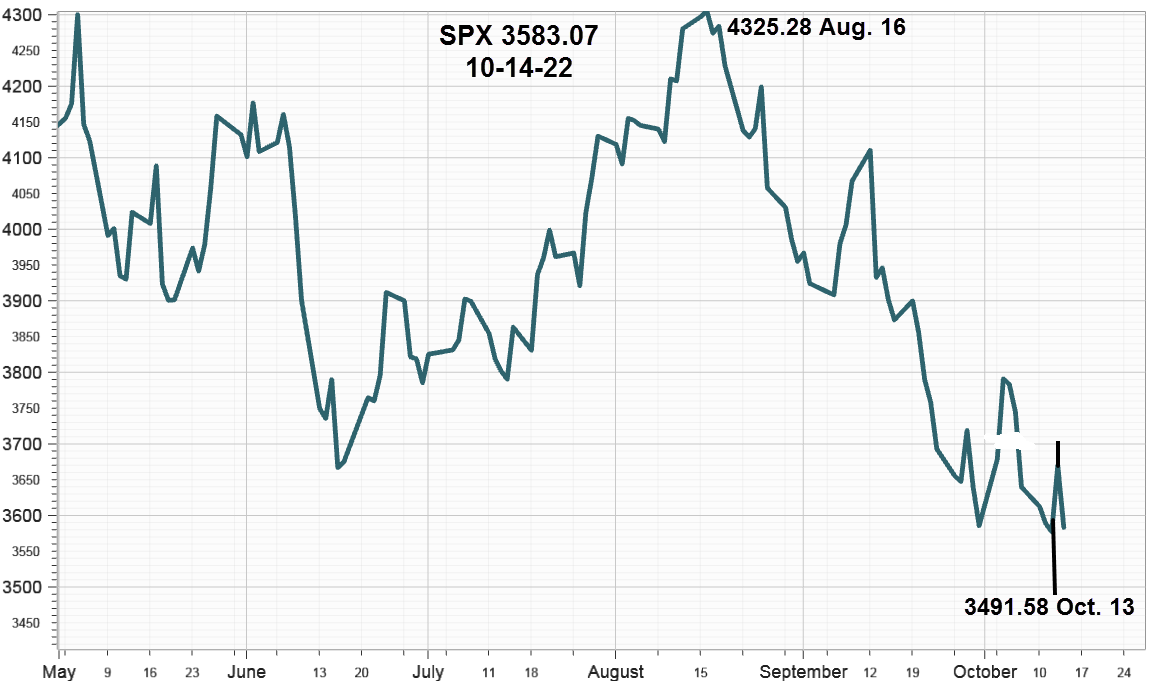
A look at E-mini futures trading shows something interesting. In the 15-minute period between 7:30 a.m. and 7:45 a.m., the futures declined 109 points or 3% to close at 3515. Then they turned up at 8:45 a.m. shortly after the release of the CPI data in what appears as a "Sell the Rumor Buy the News" event. While short covering around 3500 could explain the initial up leg of the reversal, the reason for the selling at 7:30 a.m. remains a mystery. Front running the CPI report by those in the know could be one reason.
WTI Crude Oil
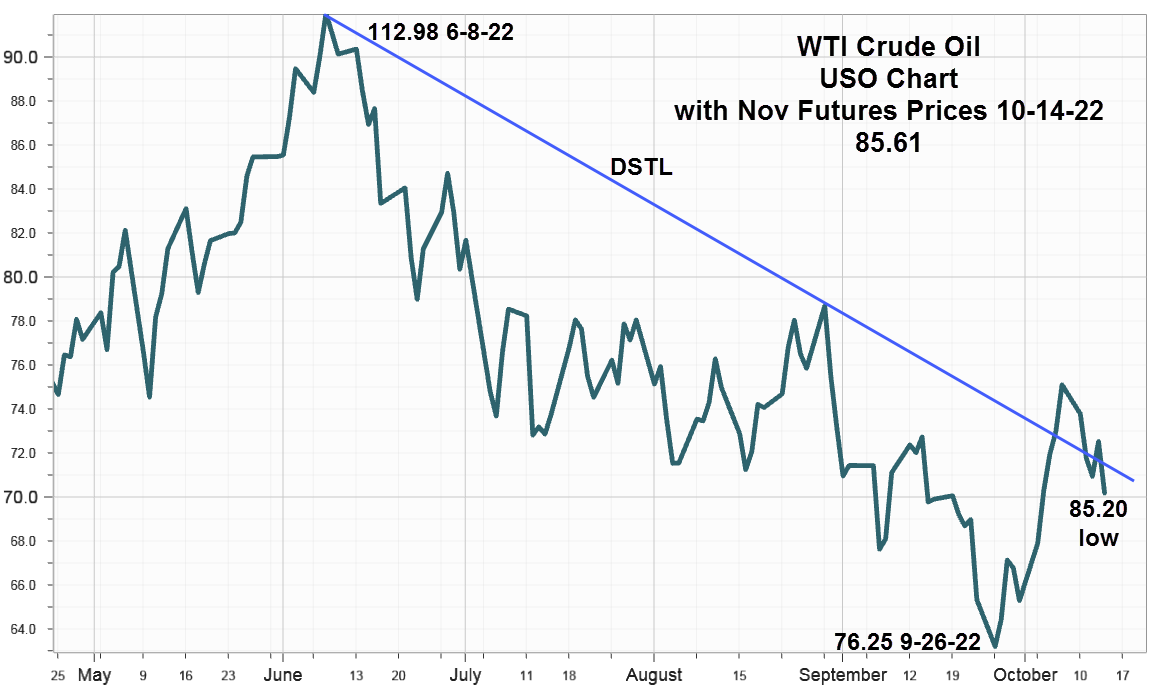
Seasonally crude oil advances in early October then slips away in November and December. The chart last week in Minor Island Top showed it closed above the downward sloping trendline (DSTL) from the June 8 high at 112.98 casting some doubt about another year-end decline. This week's chart shows it closing back below the trendline suggesting a retest around 76 before the end of the year.
Market Breadth as measured by our preferred gauge, the NYSE ratio adjusted Summation Index that considers the number of issues traded, and reported by McClellan Financial Publications declined 164.18 points last week to close at -1138.43, the lowest level since March 24, 2020 at -1256.95. After peaking at 859.79 on August 18, this breadth measure has gone from Mt. Whitney to Death Valley in less than two months quantifying current bearish sentiment.
While Q3earnings reporting began last week with the big banks and the pace picks up this week with Netflix (NFLX), Tesla (TSLA) along with other favorites. If lowered estimates were responsible in part for recent declines, perhaps some better than expected, although lowered estimates will help stabilize the market.
Implied Volatility
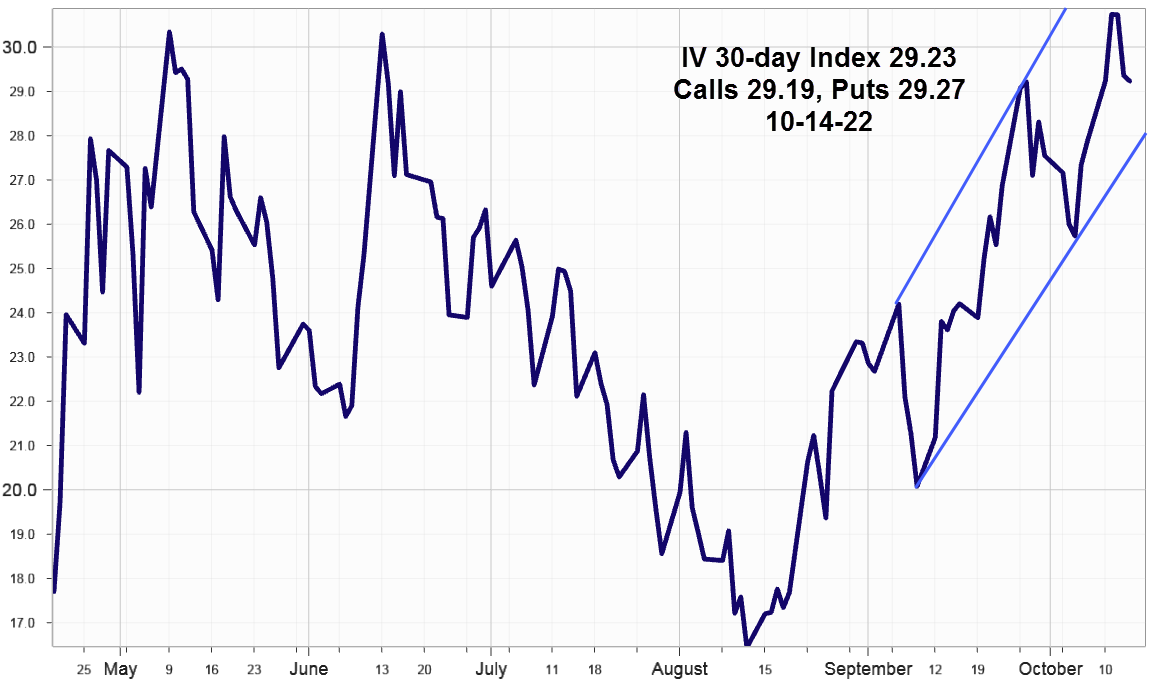
SPX options implied volatility index, IVX gained 1.37% last week to end at 29.33% with Calls at 29.19% and Puts at 29.27%. On Tuesday, the IVX made a 52-week high at 30.74 shown on the chart.
As a hedging indicator VIX options open interest totaled 10.9m contracts on Friday, with 8.1m calls and 2.8m puts, the highest count in the last six months. Hedging Q3 earnings reporting likely.
Summing Up
The release of the Consumer Price Index data on Thursday triggered an unusually wide range Key Reversal that reached its objective the next day. An early morning futures decline ahead of the release that quickly reversed after the report should raise some questions.
For WTI crude oil, the breakout above the downward sloping trendline previously noted turned renewing the probability it will decline in November and December. However, strong demand due to energy shortages and substituting oil for natural gas in Europe this winter could support prices enough to offset a typical year-end seasonal decline.
The poorest market breadth in almost three years helps quantify current bearish sentiment, however if Q3 earnings reports start coming in a bit better than expected breadth may show some improvement.
More By This Author:
CPI Figures Take Center Stage
Minor Island Top
Not Much At Surface Level, More To See Underneath
Disclaimer: IVolatility.com is not a registered investment adviser and does not offer personalized advice specific to the needs and risk profiles of its readers.Nothing contained in this letter ...
more

