
The latest seasonally adjusted inflation rate for September came in at 0.44%. The YoY rate was 7.7% or 7.8% when adjusting for Household Ops which has not been consistently reported over the last year. This was actually above the previous month of 0.38%, but the YoY number fell because last October was 0.87% and fell off the report this month.
It is important to notice that MoM actually saw an increase across many categories, specifically Shelter which continues to rise. If October CPI were annualized, the rate would be 5.4% which is still well above the Fed’s 2% target.
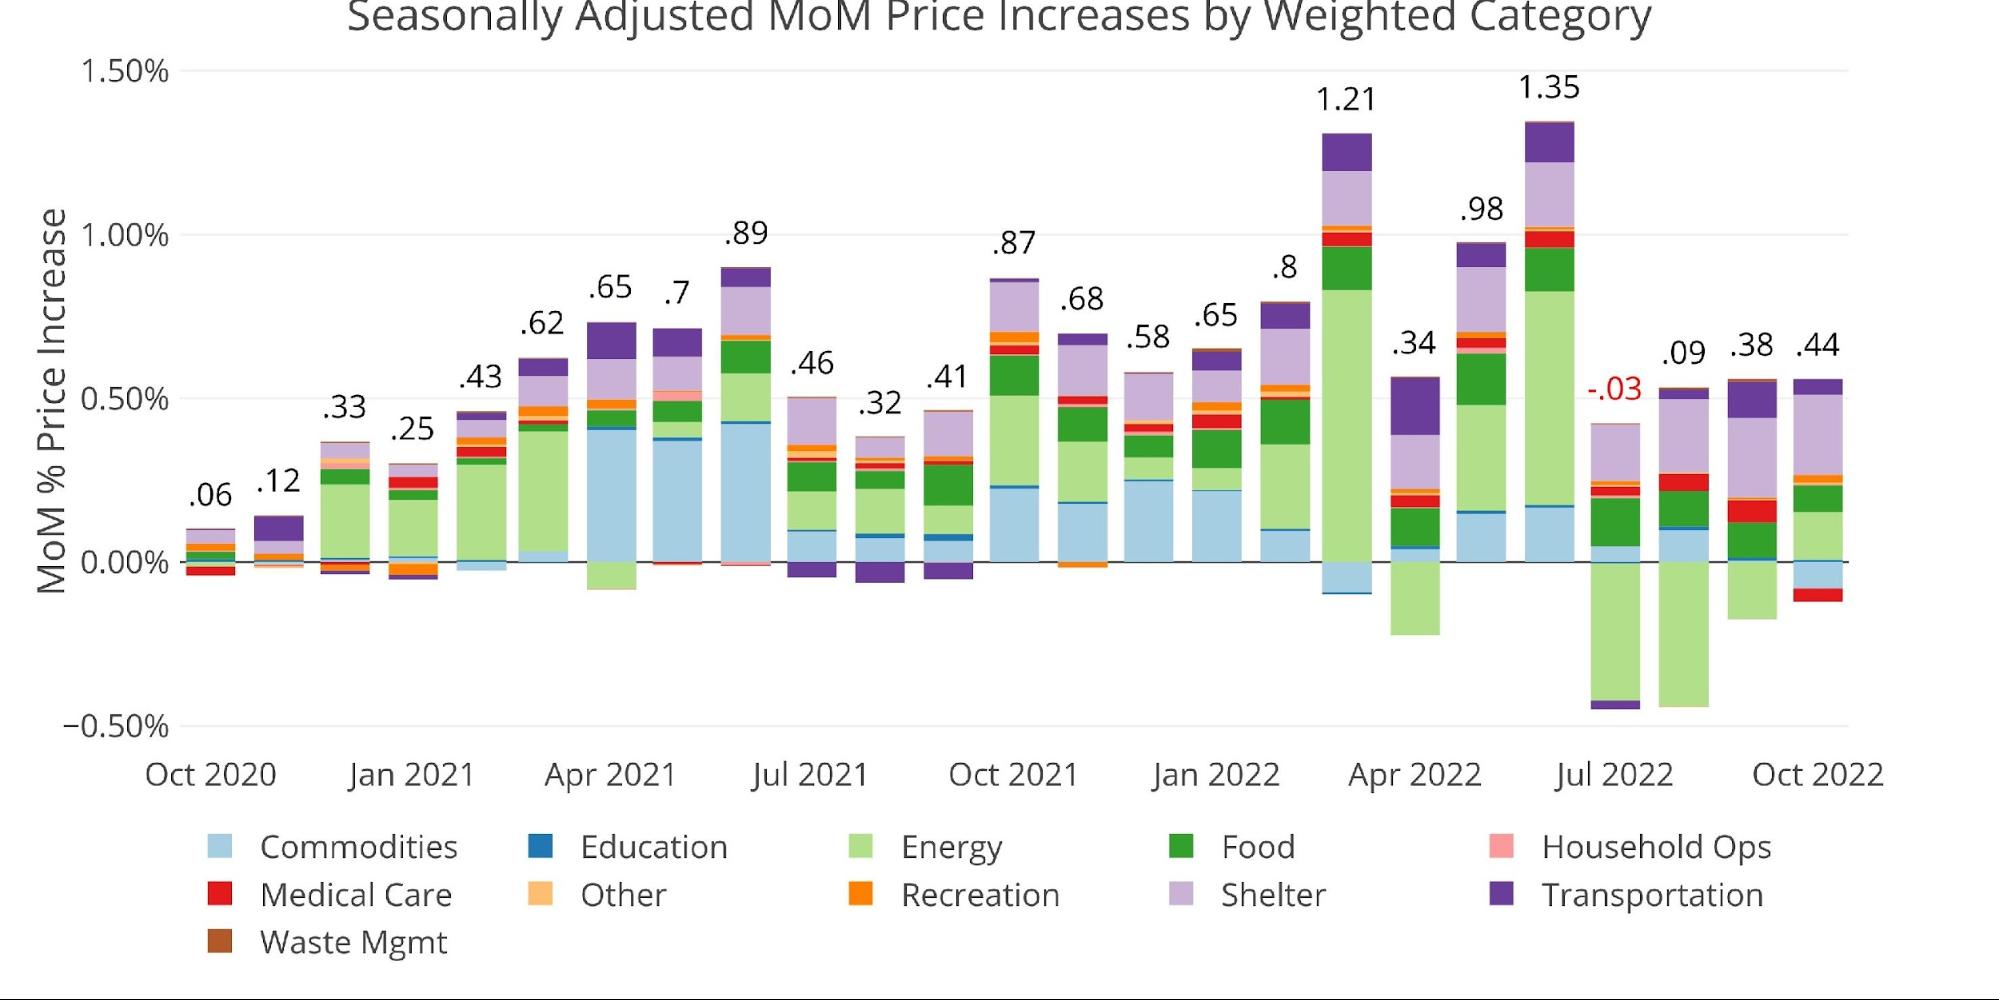
Figure: 1 Month Over Month Inflation
Despite Biden’s attempt to slow inflation by using the Strategic Petroleum Reserve (SPR) for political purposes, Energy actually increased MoM by 1.8%. The drawdown in the SPR can be seen below with another 20M barrels of oil being used in October.
This has provided some relief in the CPI, but that relief will be temporary once the SPR is fully depleted or Biden decides to turn off the spigots now that the elections are over.
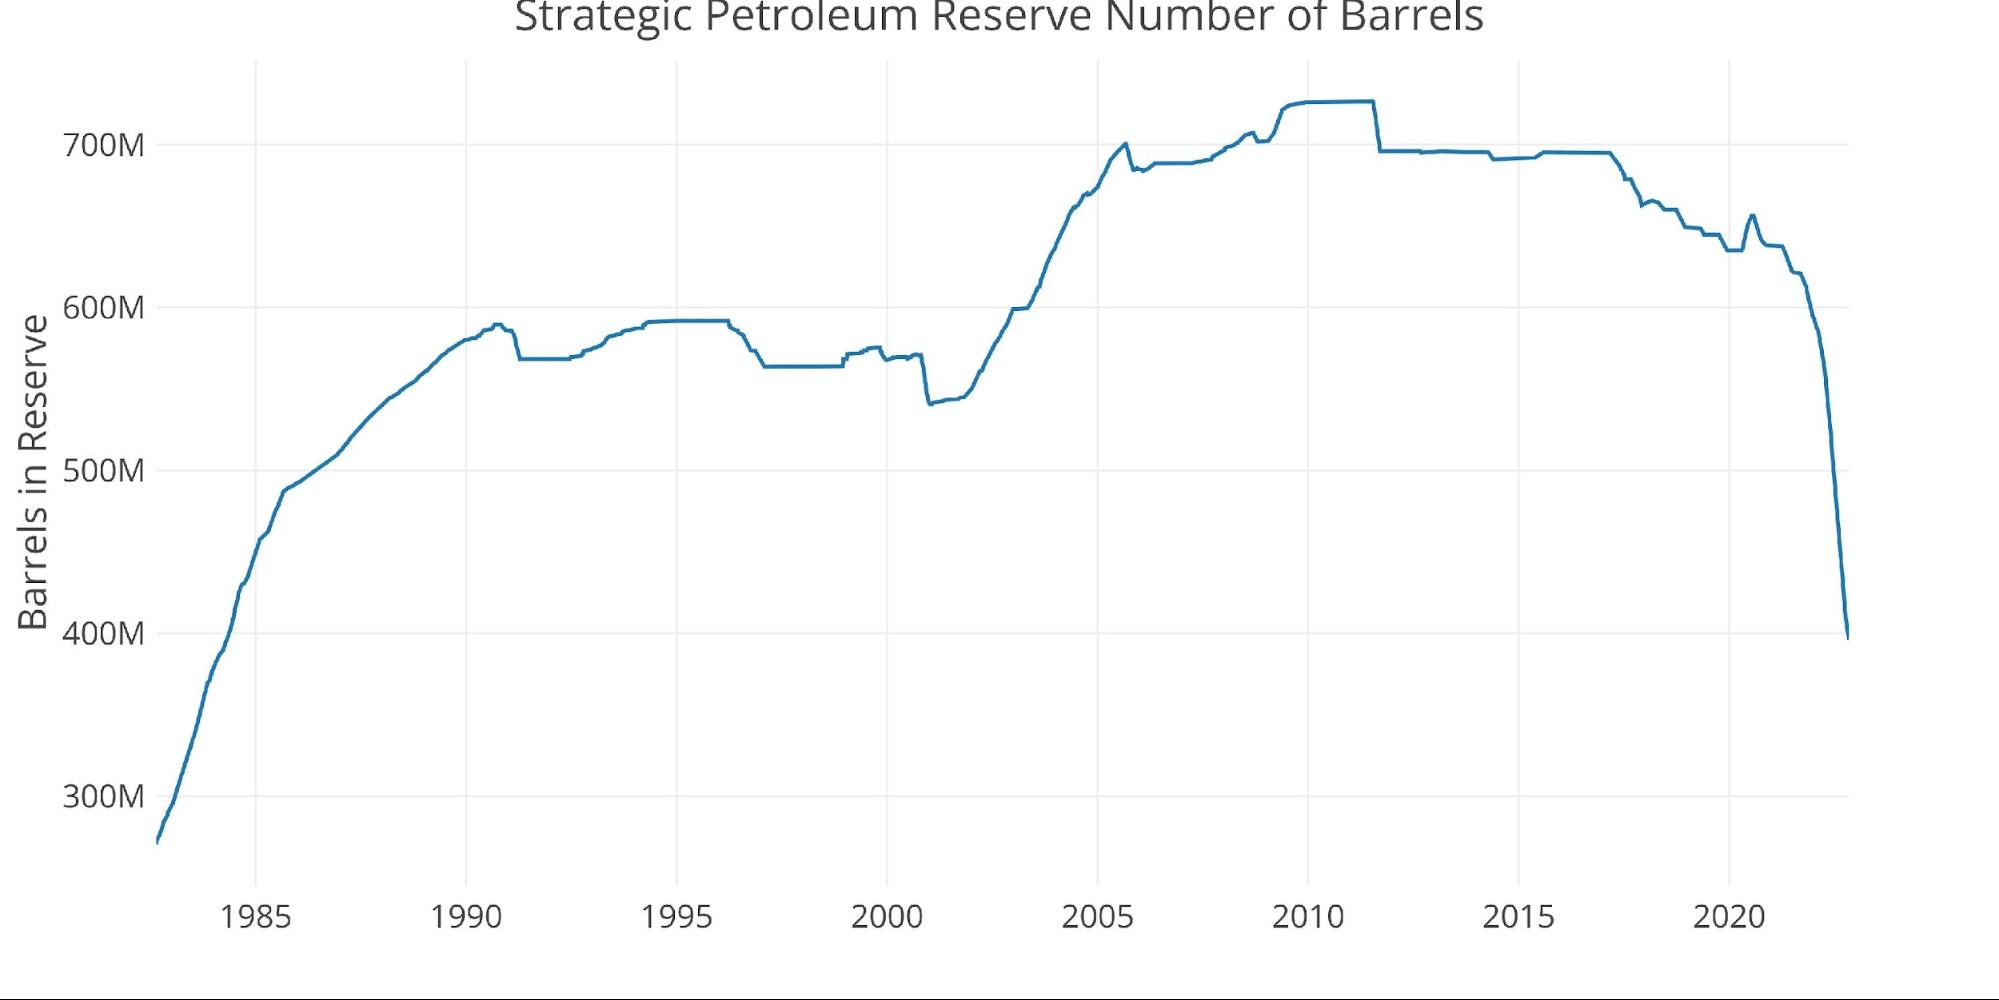
Figure: 2 SPR Inventory
When looking at the YoY numbers, it’s clear to see that much of the drawdown over the last few months has come from Energy and Commodities (Used Cars) while other categories are still rising.
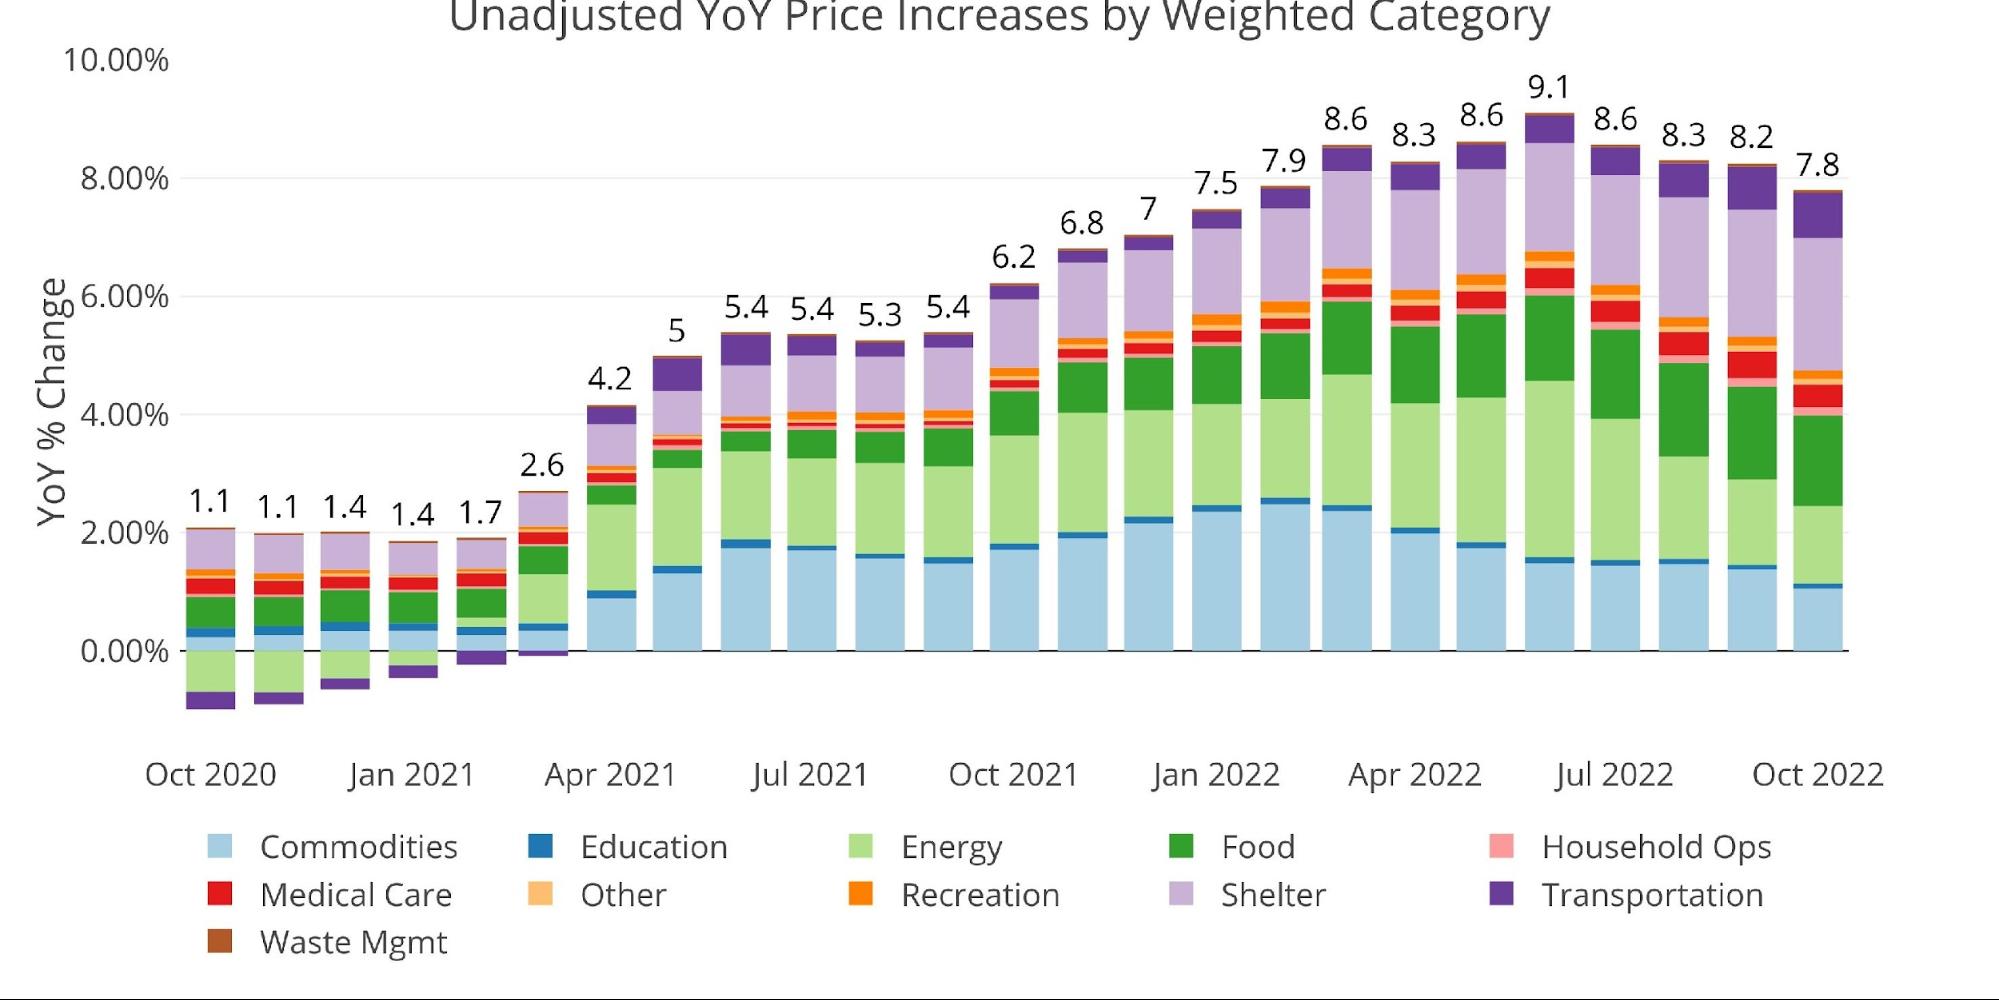
Figure: 3 Year Over Year Inflation
The chart below compares the current month to the 12-month average. Shelter and Energy which make up 40% of the CPI were both well above the 12-month average.
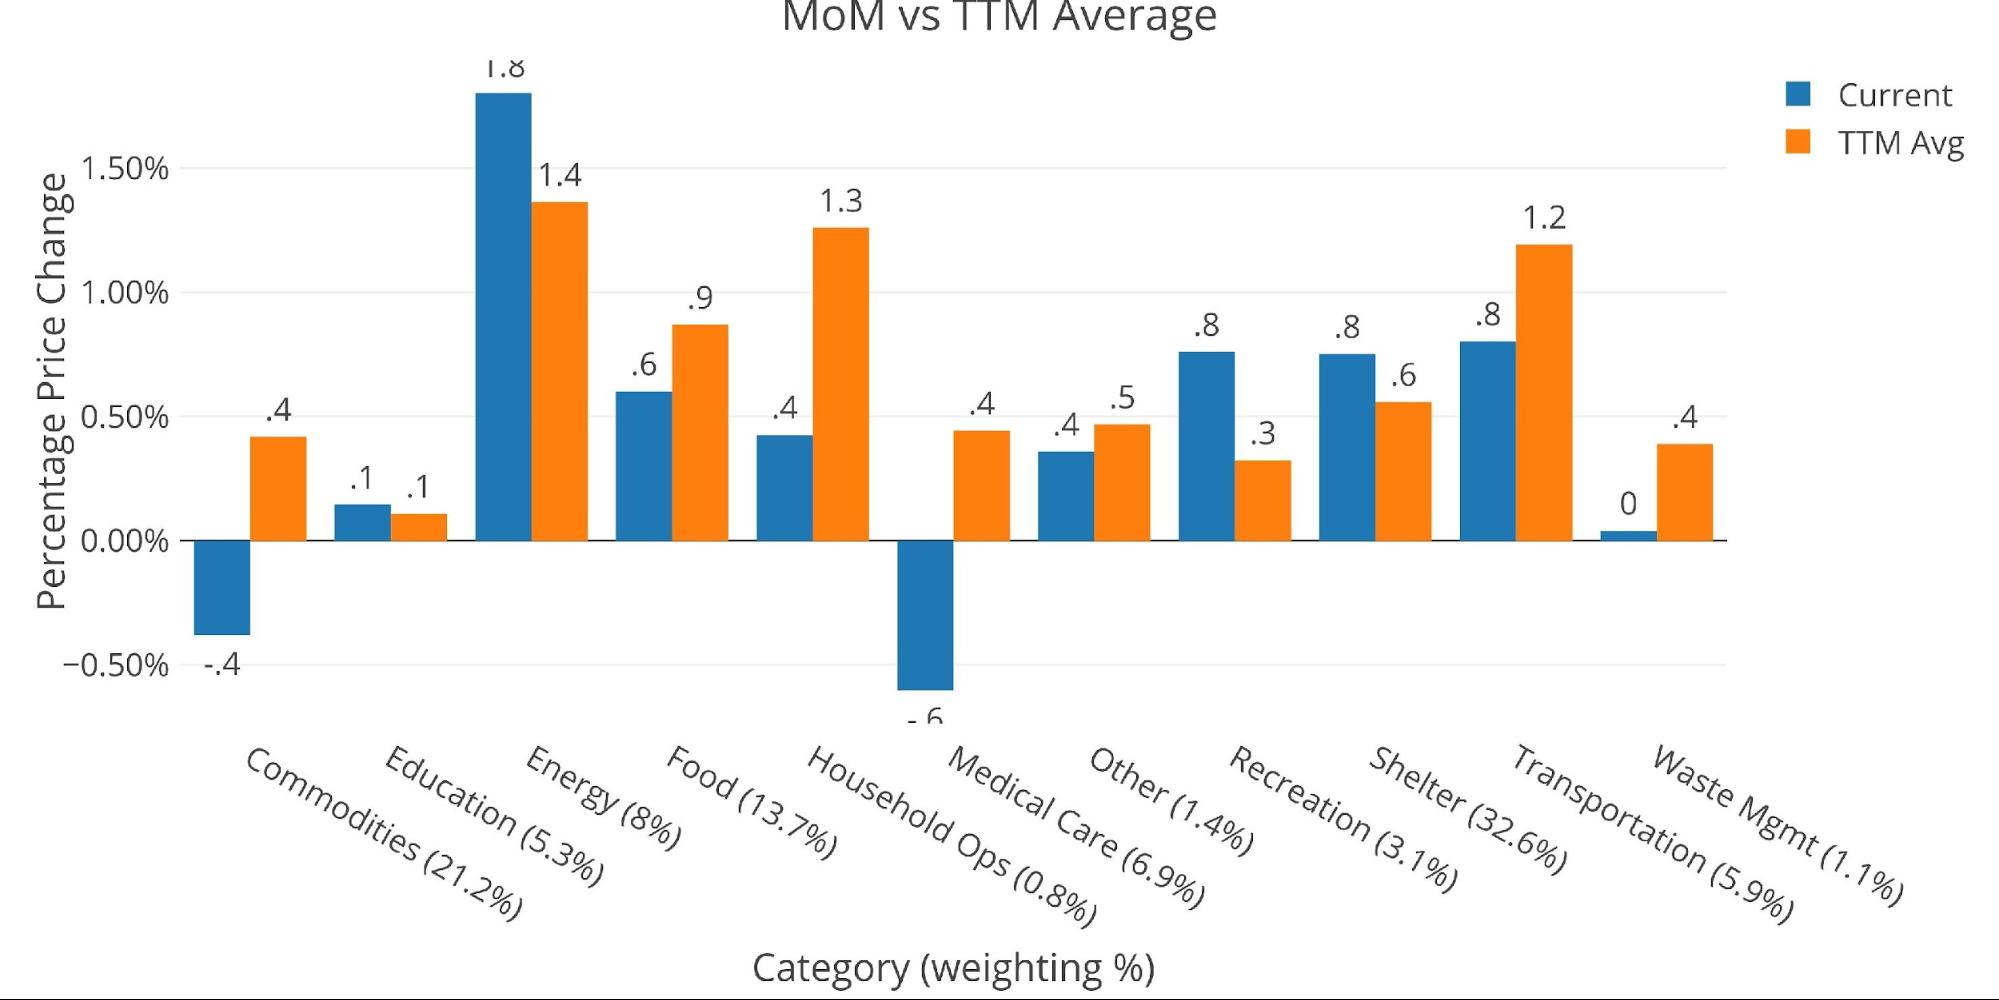
Figure: 4 MoM vs TTM
The table below gives a more detailed breakdown of the numbers. It shows the actual figures reported by the BLS side by side with the recalculated and unrounded numbers. The weighted column shows the contribution each value makes to the aggregated number. Details can be found on the BLS Website.
Some key takeaways:
-
- The fall in Medical Care was almost entirely driven by a 4% reduction in Insurance Costs
- The fall in Commodities was driven by a fall in Used Cars/Trucks of 2.4%
- While Transportation was still up MoM, the increase slowed mainly due to car rental and repair services
- Shelter rose 6.91% YoY which still understates market rates which are showing a rise of 9%
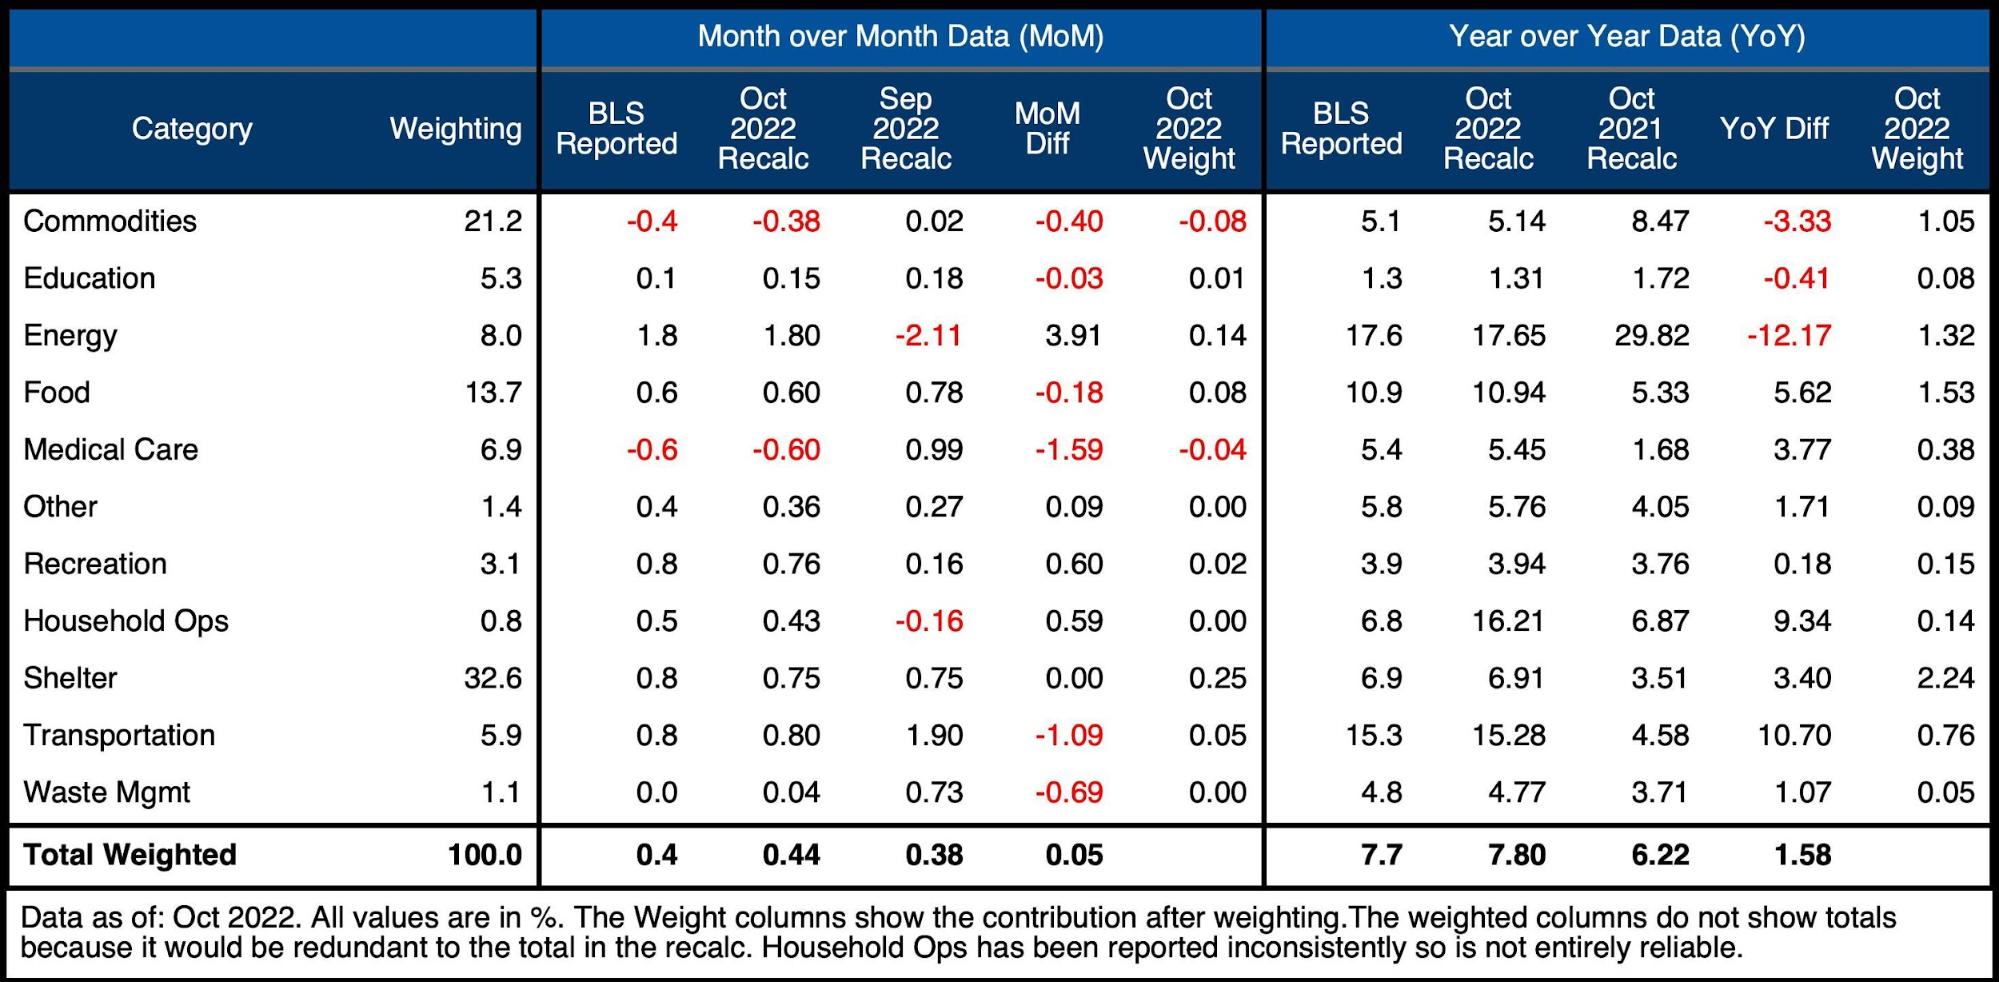
Figure: 5 Inflation Detail
Looking at the Fed Numbers
While the Fed does have different categories, its aggregate numbers match the BLS.
Their data goes back to the 1950s. Unfortunately, they do not publish the weightings of each category so it would be impossible to do a similar analysis showing the impact of each category on the overall number.
Looking at history back to 1950 puts the current spike into perspective. According to the Taylor Rule, the current Fed Funds rate should be above the rate of inflation. This has been necessary in the past to bring inflation back down. Thus, despite the big interest rate hikes, the Fed is still not doing enough to combat inflation.
This is because the economy and Federal government are entirely dependent on easy money and low interest rates for survival. As shown in the debt analysis, the interest on the debt is already on pace to be a massive problem in the months ahead based on the current Fed trajectory.
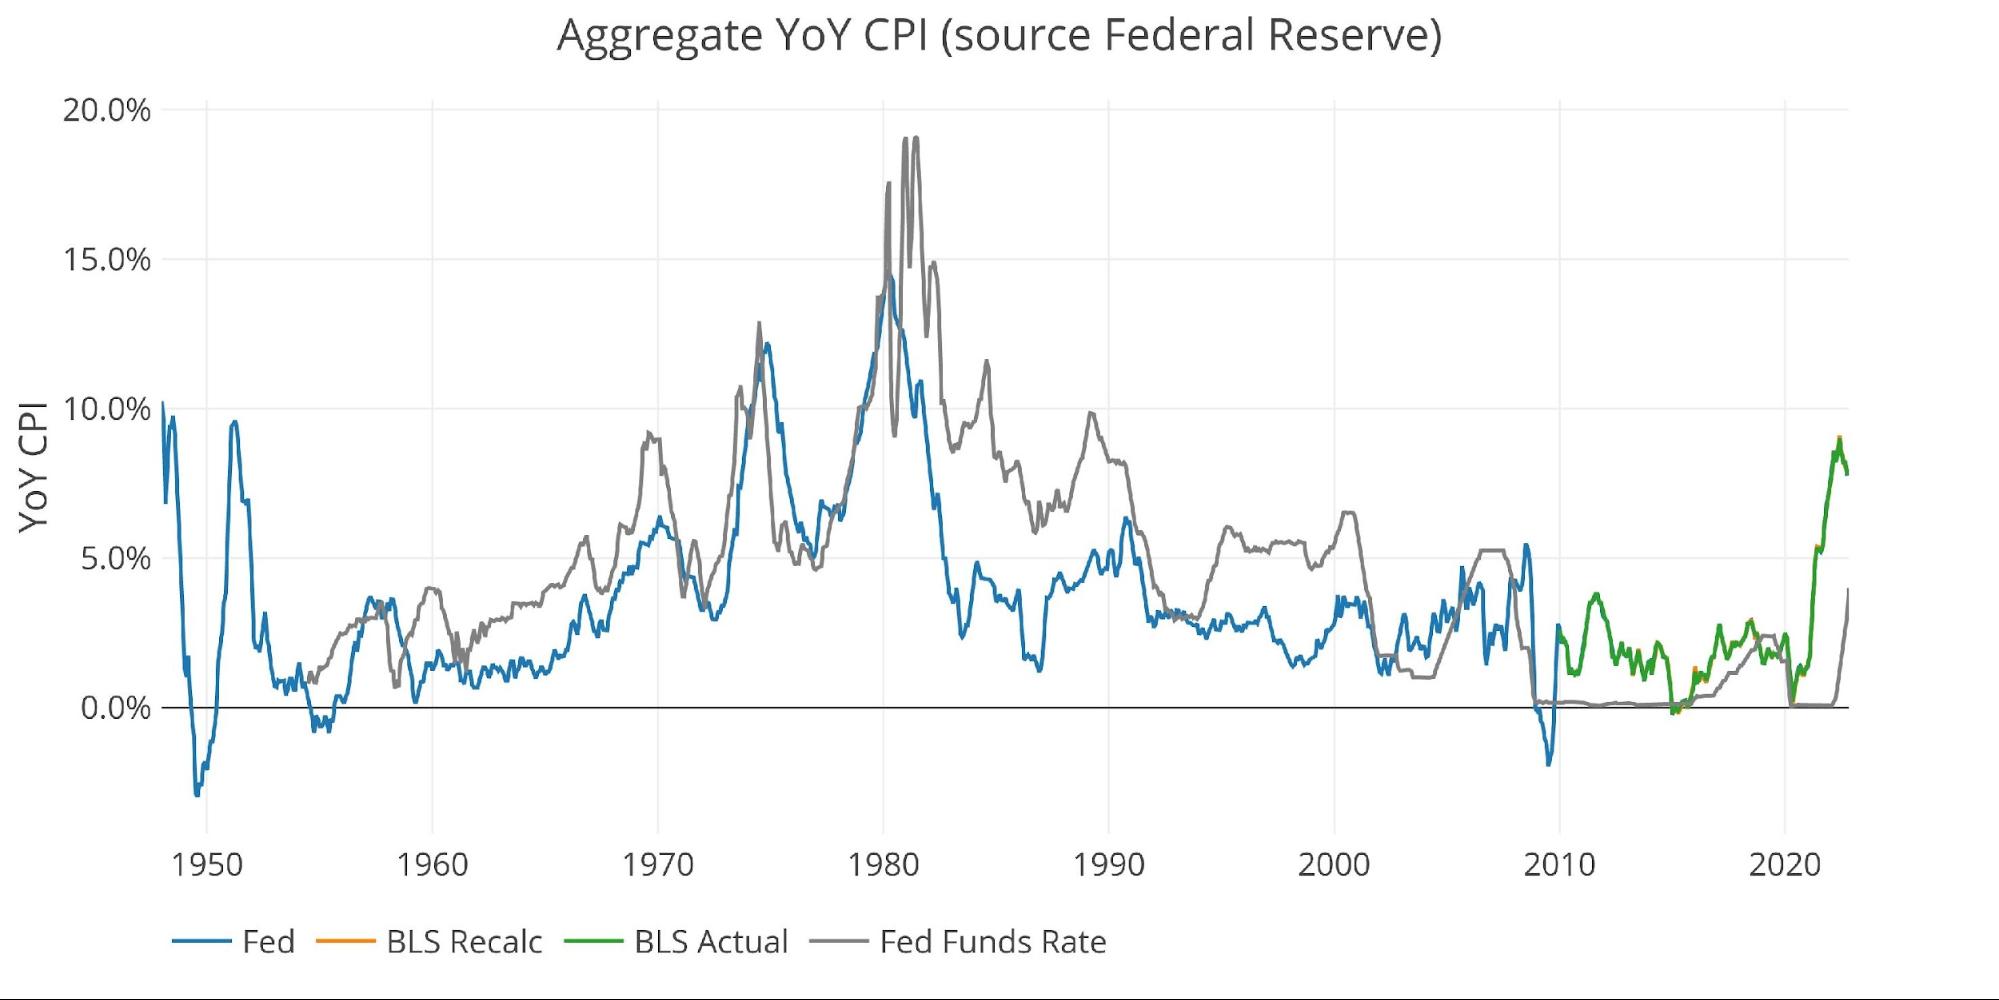
Figure: 6 Fed CPI
Using the Fed categorical data shows a better picture than the BLS. In this view, only Recreation is above the 12-month trend. It should be noted though that 5 categories are well above the 20-year trend.

Figure: 7 Current vs History
Historical Perspective
The BLS weightings have only been scraped back to 2012, thus the chart below shows the past 10 years of annual inflation data, reported monthly. The volatility in Energy can be seen clearly over this time period.
The YoY CPI first went over 4% in April of 2021. It will take a lot more effort by the Fed to get the CPI back below 4%, especially when the current drop is driven mainly by Commodities as shown below.
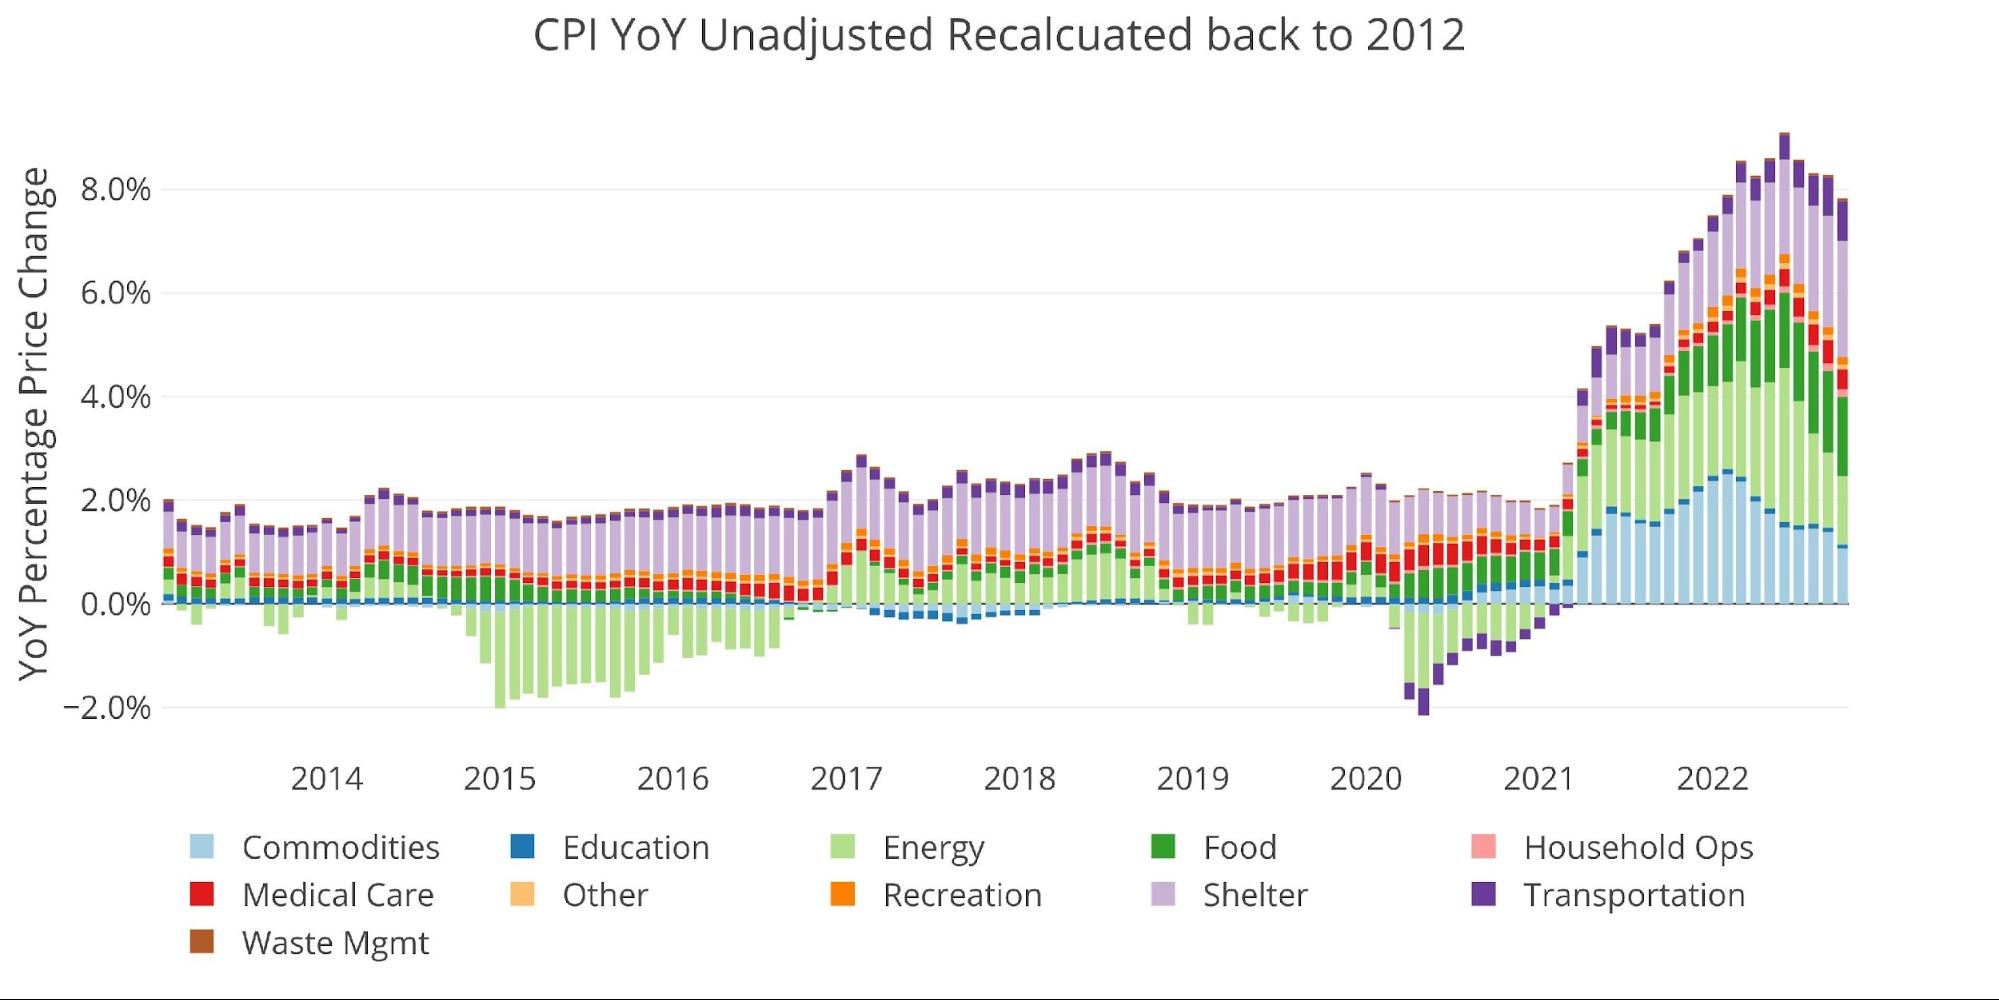
Figure: 8 Historical CPI
What it means for Gold and Silver
In the CPI analysis last month, the conclusion highlighted the likelihood of a decent drop in the CPI this month due to the large October 2021 number falling off. The same is likely next month as the 0.68% in November 2021 falls off.
Despite these decreases, it should be noted that the current CPI is still very high, rising at an annual pace of 5.4%. As the windfall from the SPR fades, the recent Energy relief will dissipate. Furthermore, this month was primarily helped by a few very large falls in specific categories (e.g., Insurance, Used Cars, Laundry Equipment, and Smartphones). Is it likely that these large drops continue? Maybe.
What happens when the Fed realizes that it has most likely already broken something? It will have to pivot and flood the market with more liquidity. This will push inflation back up and also show the market that the Fed has been bluffing all along.
Gold and silver are surging today because inflation was low. Someday soon, they will start surging when inflation is high. That is when the Fed will have reached the end of its rope.
Data Source: https://www.bls.gov/cpi/ and https://fred.stlouisfed.org/series/CPIAUCSL
More By This Author:
Auto Loan Delinquencies At 10-Year High
Americans Pile On Another $25 Billion In Consumer Debt
Optimal Investment Portfolio Should Include 4 To 6 Percent Silver And Other Silver News

Comments
Log in or sign up to join the conversation.