CPI: This Game Of Chicken Is Almost Over
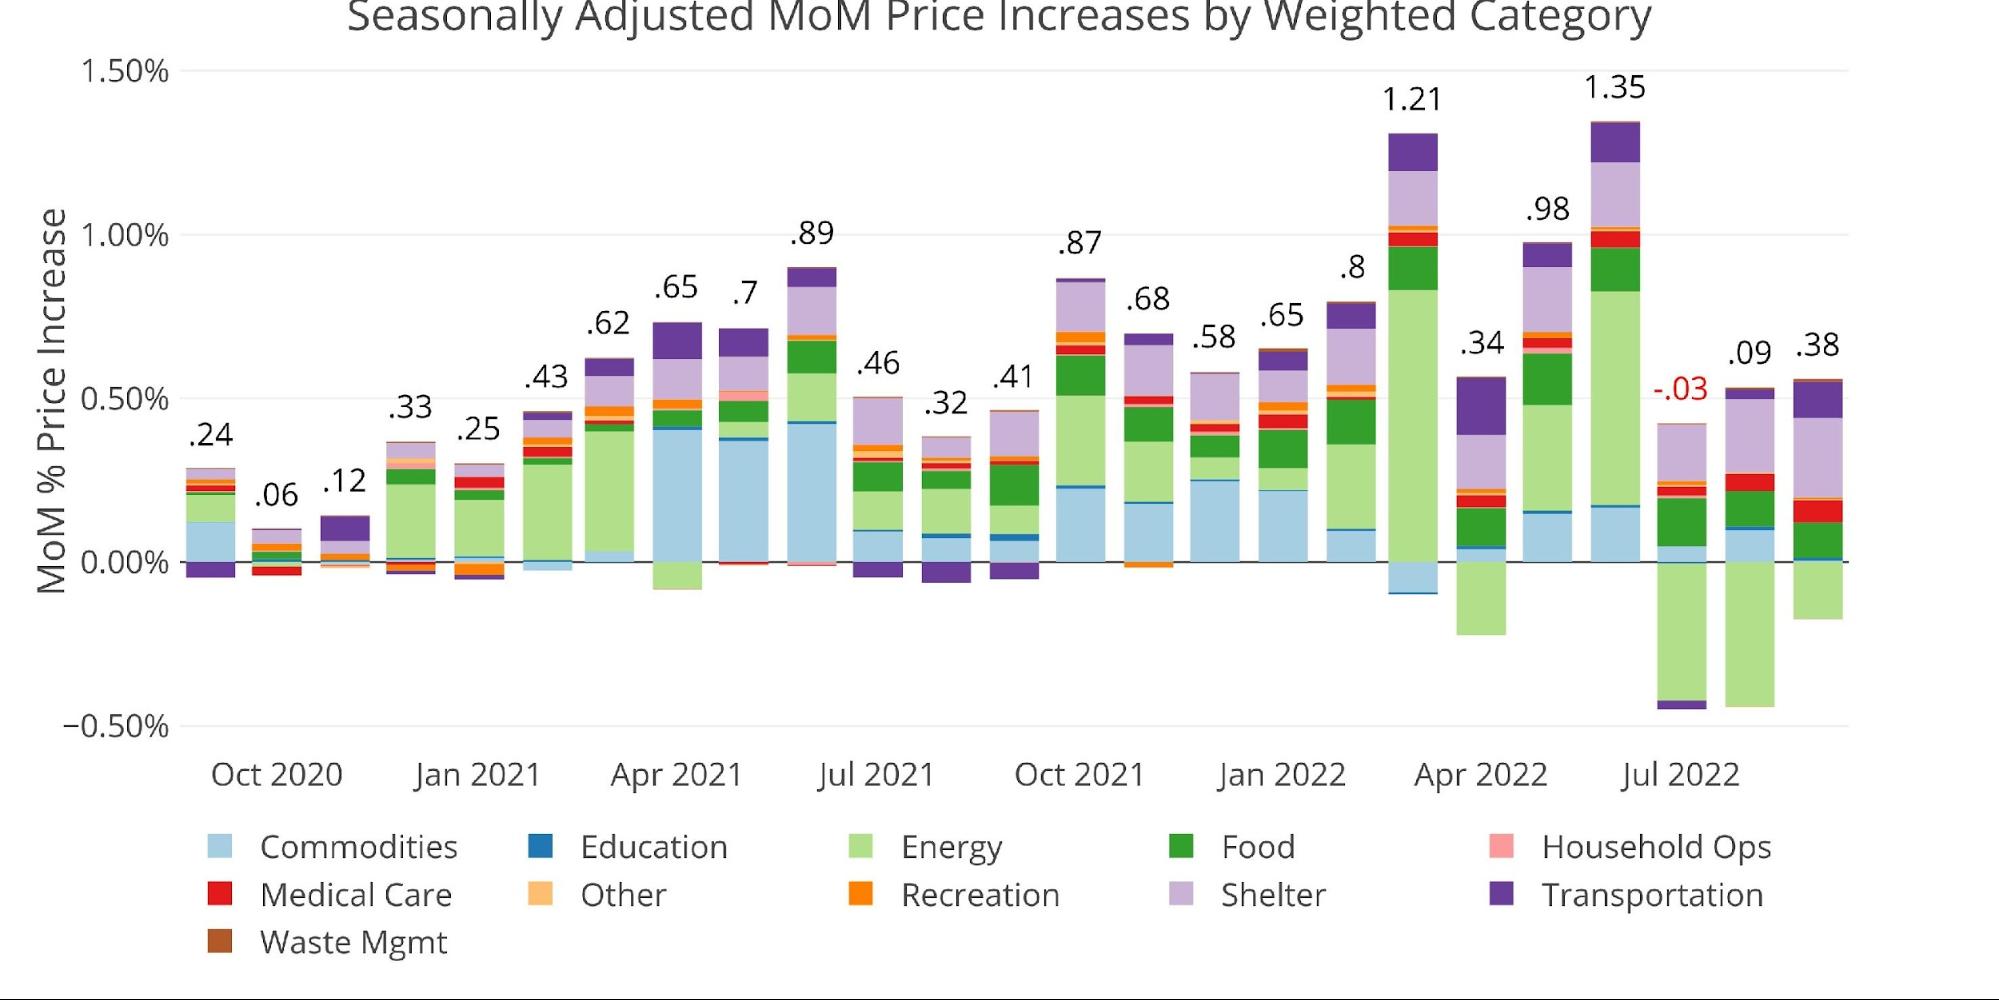
The latest seasonally adjusted inflation rate for September came in at 0.38%, dropping to 8.25% YoY. Median expectations had been for 0.3% MoM and 8.1% YoY so the hot number hammered markets on the open, especially precious metals.
The markets have climbed their way back as of publishing, indicating the market may be starting to understand the Fed’s predicament even though the probability of a 75bps hike in November is now a near certainty at 99%.
Figure: 1 Month Over Month Inflation
The CPI was again held back by falling Energy prices. This could be partially driven by the Biden administration’s horrendous and shameful decision to use the Strategic Petroleum Reserve (SPR) for political purposes. One of the most valuable emergency assets the US has is the SPR and it has been depleted to levels not seen since 1984 as shown below.
Figure: 2 SPR Inventory
What happens when the draw-down ends in November (when it can no longer help the election)? Perhaps they will extend the releases and fully deplete the emergency stockpile. In either case, eventually, the releases will stop and it’s quite possible energy prices could start to surge given the geopolitical environment.
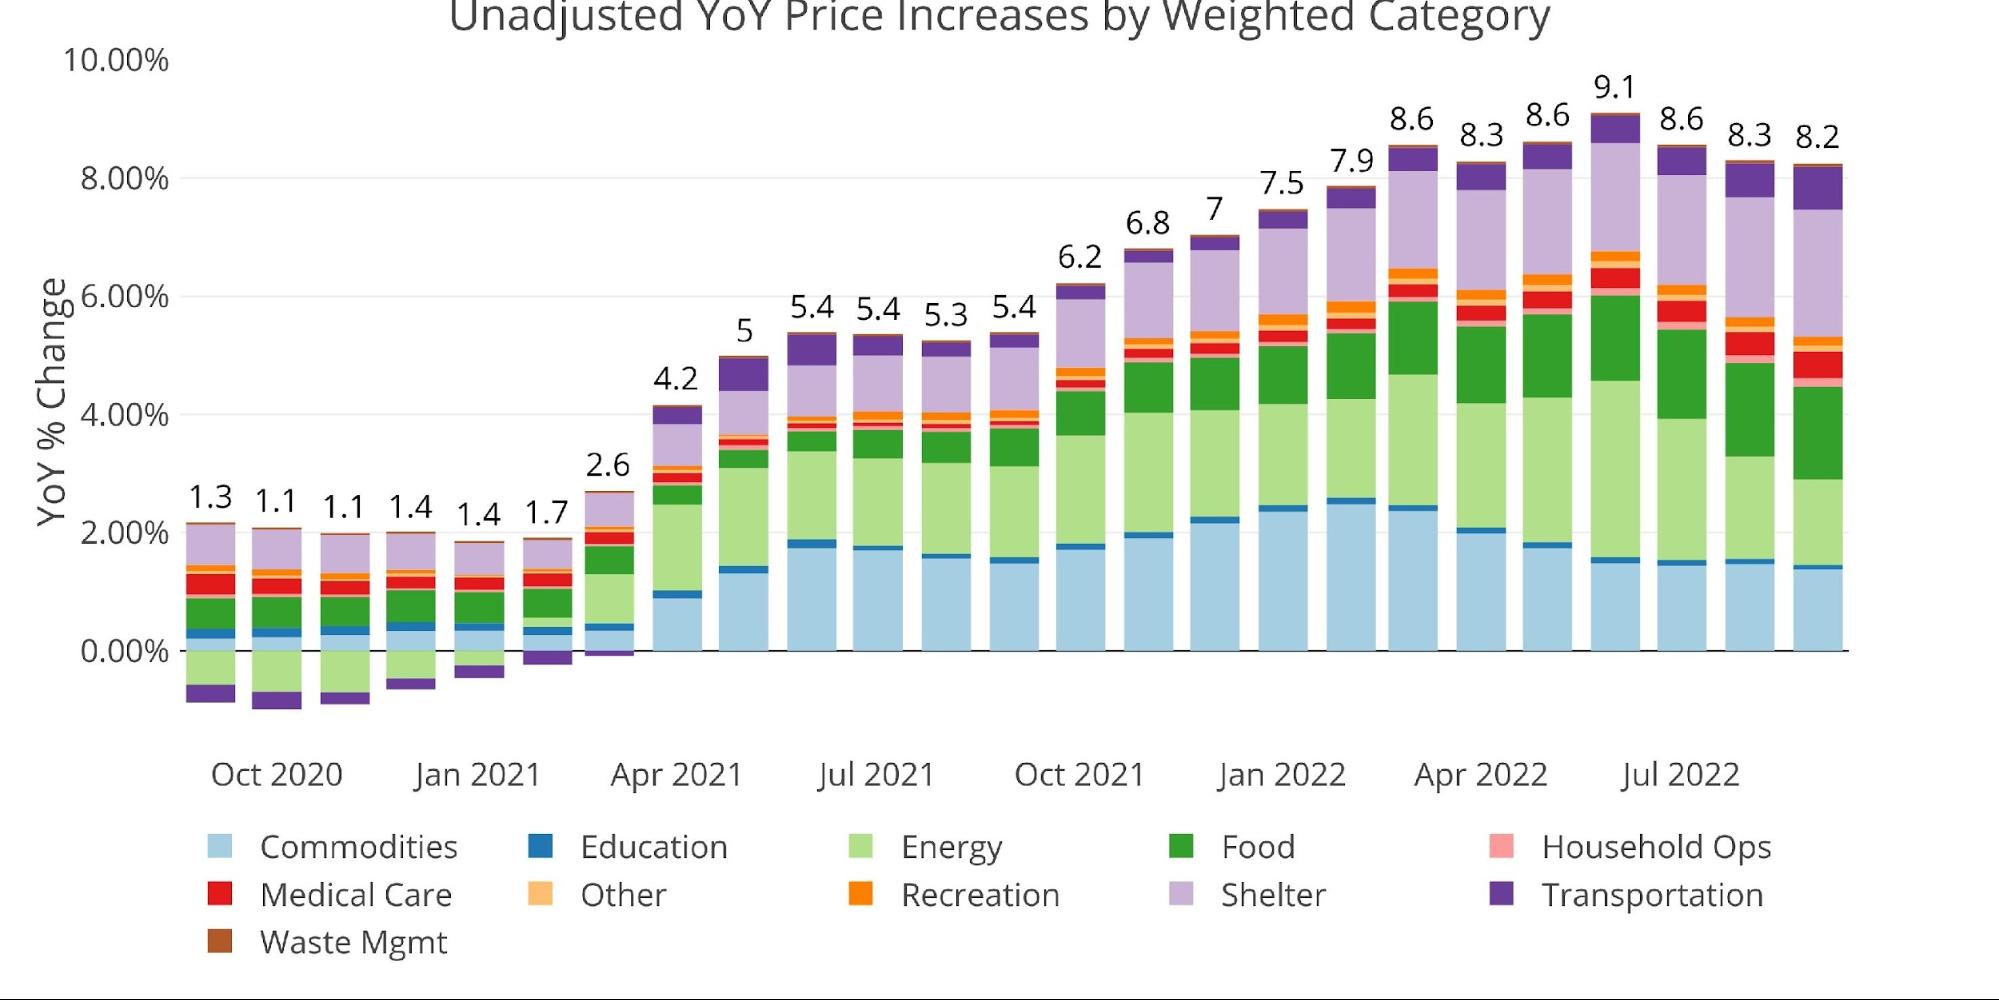
The YoY CPI has clearly been helped by falling energy prices. This would reverse quickly with a spike in prices.
Figure: 3 Year Over Year Inflation
The chart below compares the current month to the 12-month average. The fall in energy prices can be seen clearly in this chart with the current month at -2.1% vs 1.5% for the 12-month average.
Unfortunately, many of the other big categories are still increasing relative to the 12-month average. Specifically, Education, Medical Care, Shelter, and Transportation. These categories collectively make up more than 50% of the CPI. This will make it very hard for the CPI to come down when so many components are still increasing.
Figure: 4 MoM vs TTM
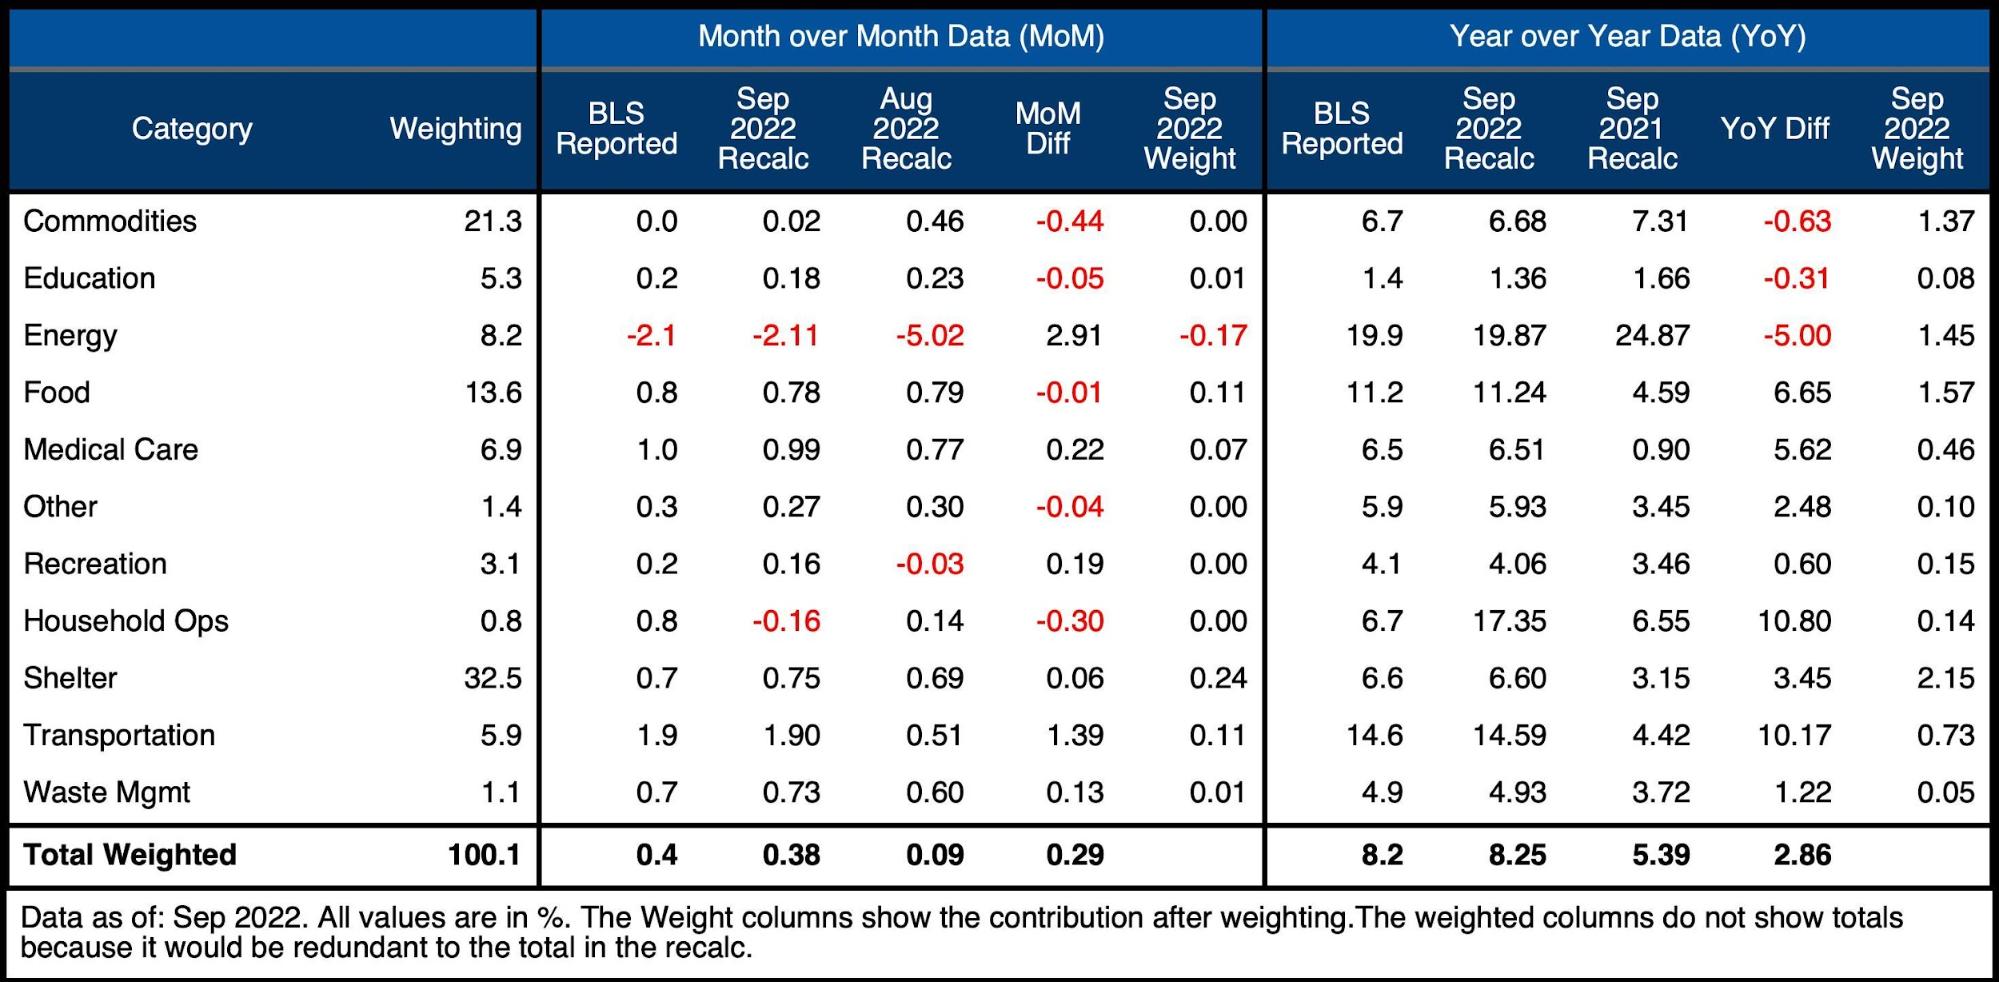
The table below gives a more detailed breakdown of the numbers. It shows the actual figures reported by the BLS side by side with the recalculated and unrounded numbers. The weighted column shows the contribution each value makes to the aggregated number. Details can be found on the BLS Website.
Some key takeaways:
-
- Energy only fell by 2% MoM and contributed to -0.17% to the overall number
-
- Energy prices have already started moving up
- Had Energy been 0% this month the overall number would have been 0.55% MoM!
-
- Shelter in the CPI was up 0.75% MoM and 6.6% YoY
-
- This still grossly understates market estimates that have YoY increases above 10%.
- Market rates have been moderating some, but are still well above the CPI
-
- Energy only fell by 2% MoM and contributed to -0.17% to the overall number
Figure: 5 Inflation Detail
Looking at the Fed Numbers
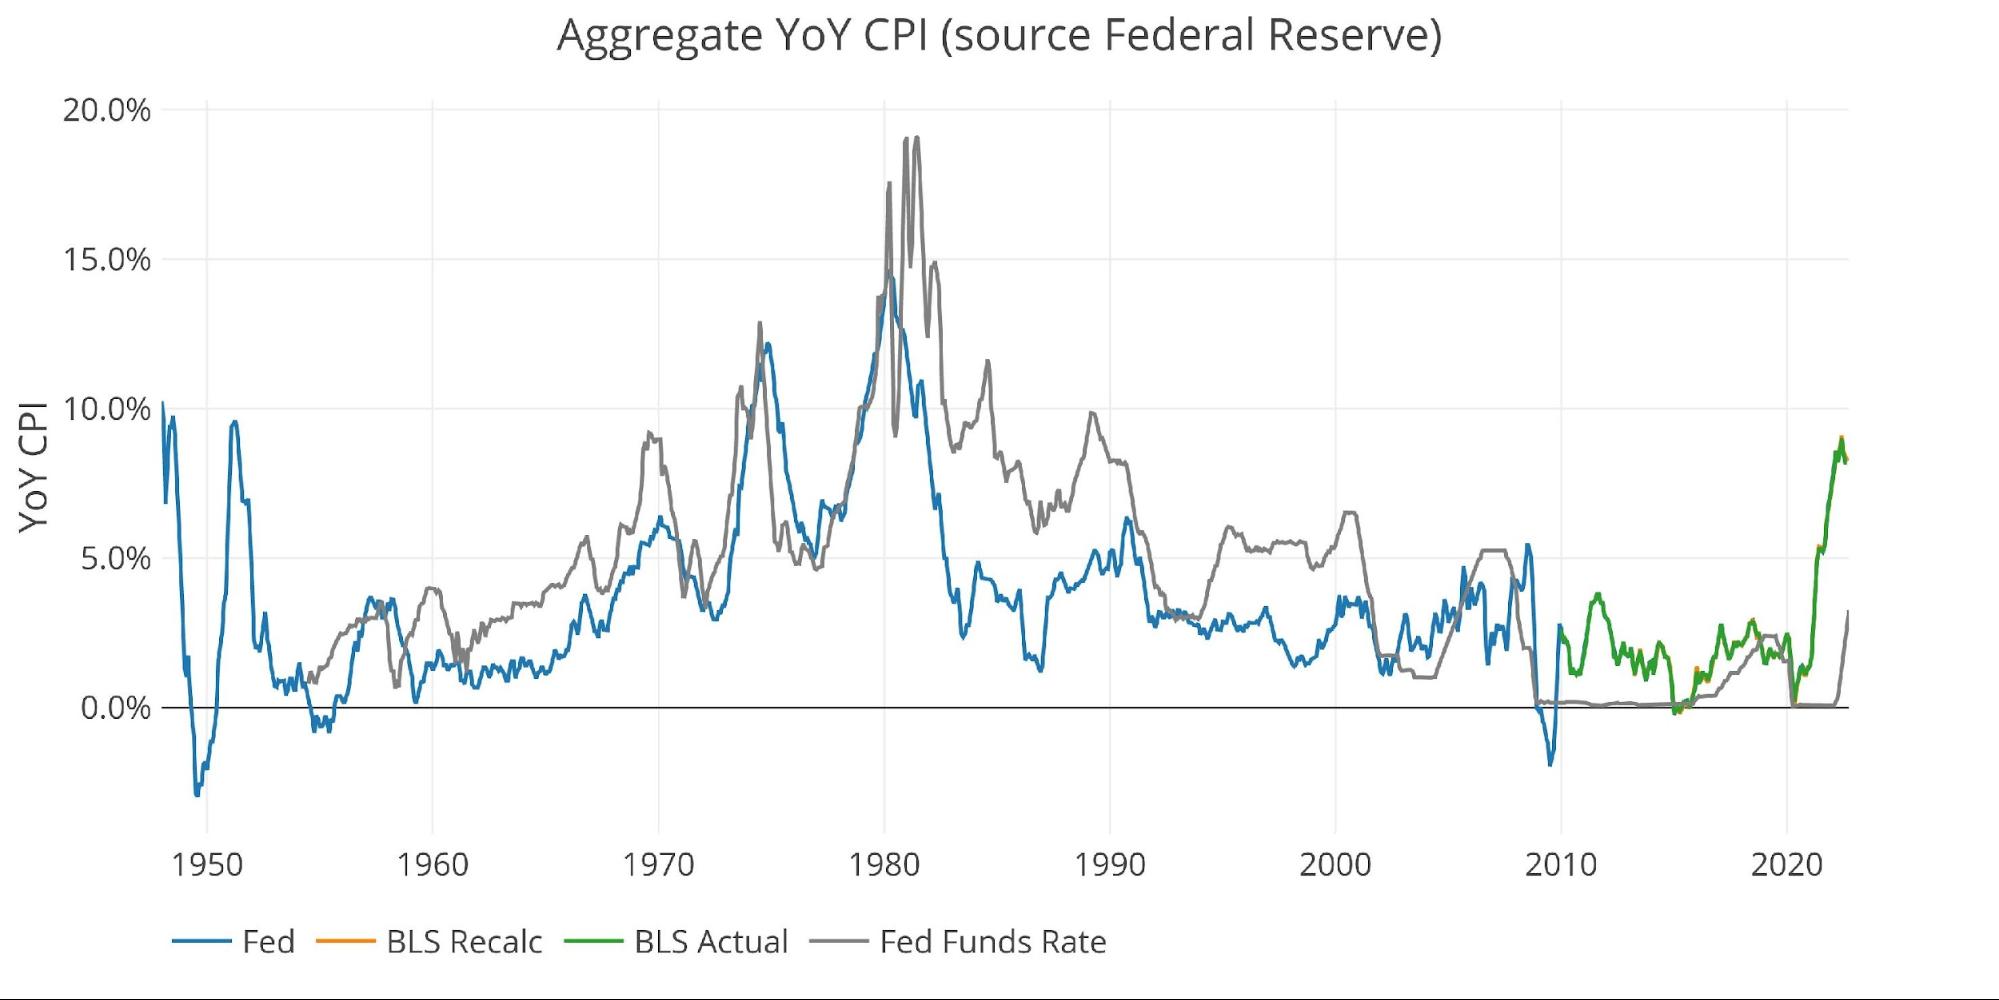
While the Fed does have different categories, its aggregate numbers match the BLS.
Their data goes back to the 1950s. Unfortunately, they do not publish the weightings of each category so it would be impossible to do a similar analysis showing the impact of each category on the overall number.
Looking at history back to 1950 puts the current spike into perspective. Remember that if the methodology was the same, inflation would still be above 15%!
Unfortunately for the Fed, things are different this time because the US Debt is now over $31T! This is why the Fed Funds rate (gray line) is still so far below the inflation rate.
They cannot actually raise rates without creating a complete meltdown in the markets. That being said, they have likely done enough already to sow the seeds for the next crisis.
Figure: 6 Fed CPI
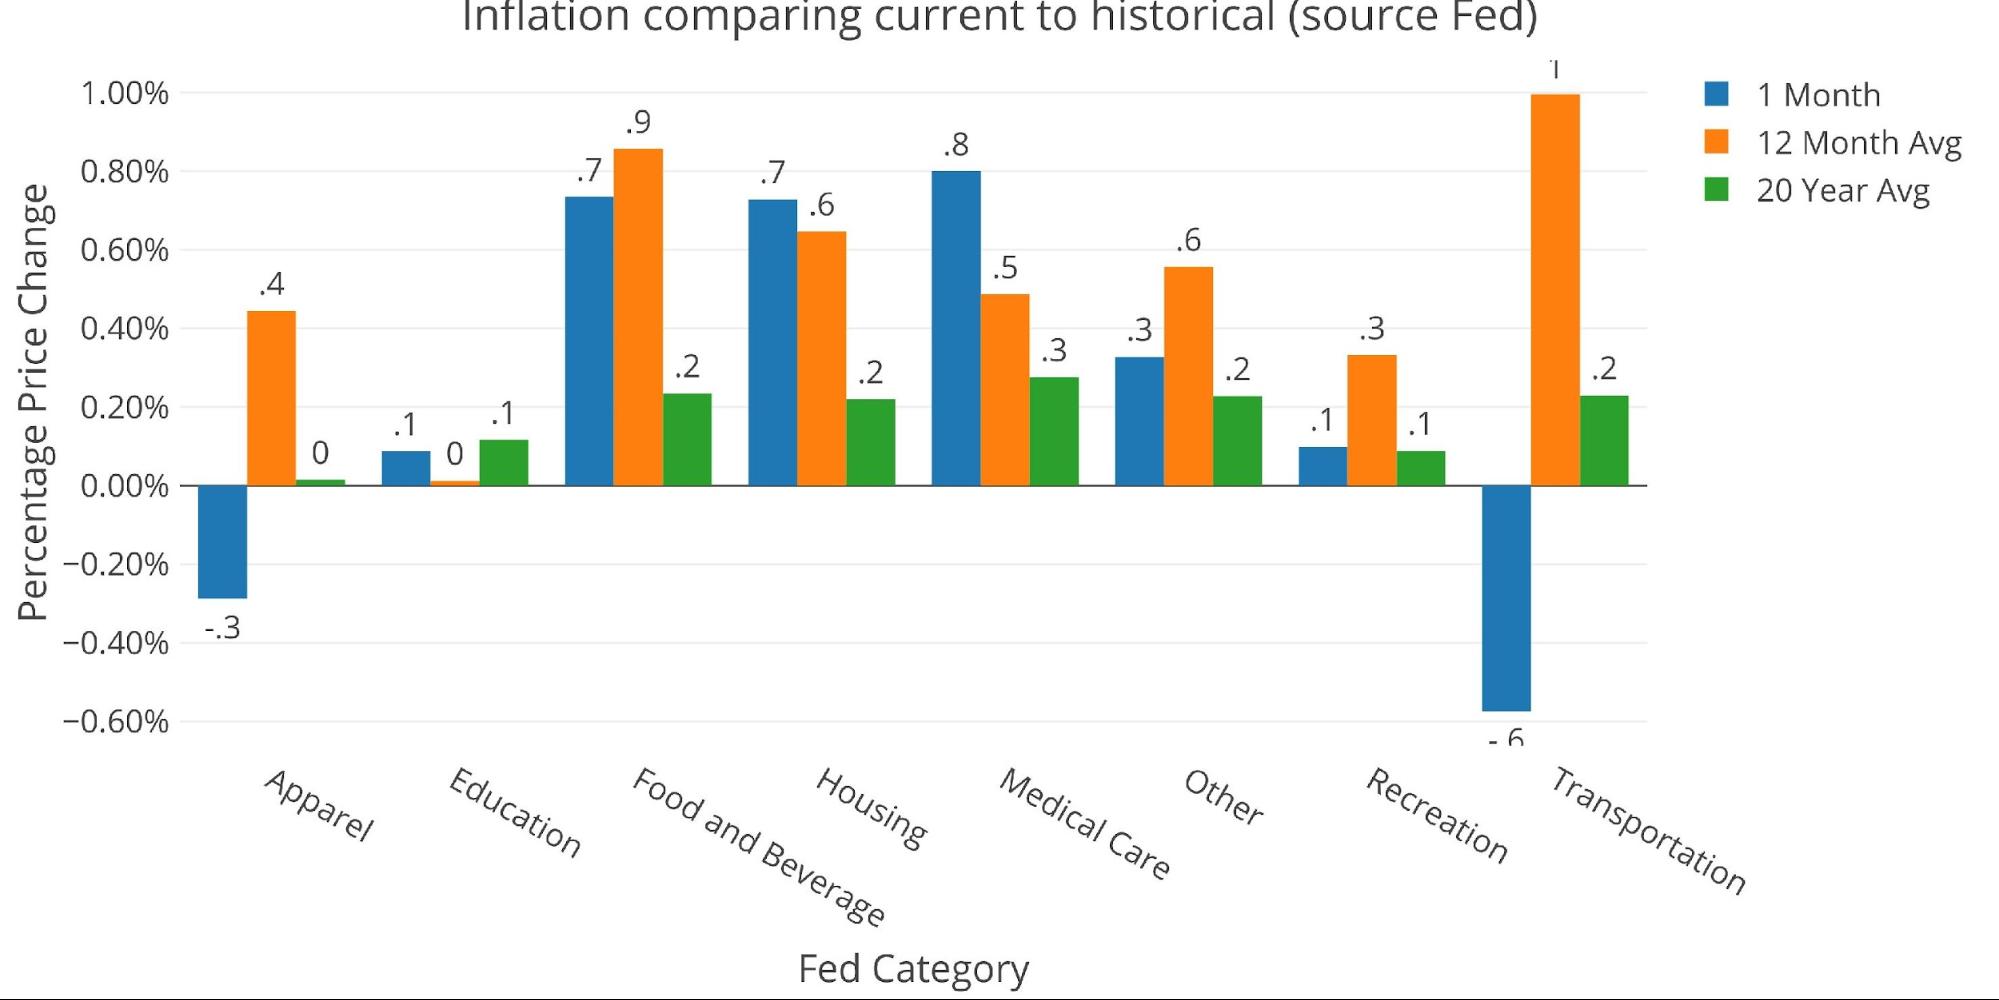
Using the Fed categorical data shows a slightly better picture, with most categories below the 12-month average. The exception is Housing and Medical Care which are still very high.
Figure: 7 Current vs History
Historical Perspective
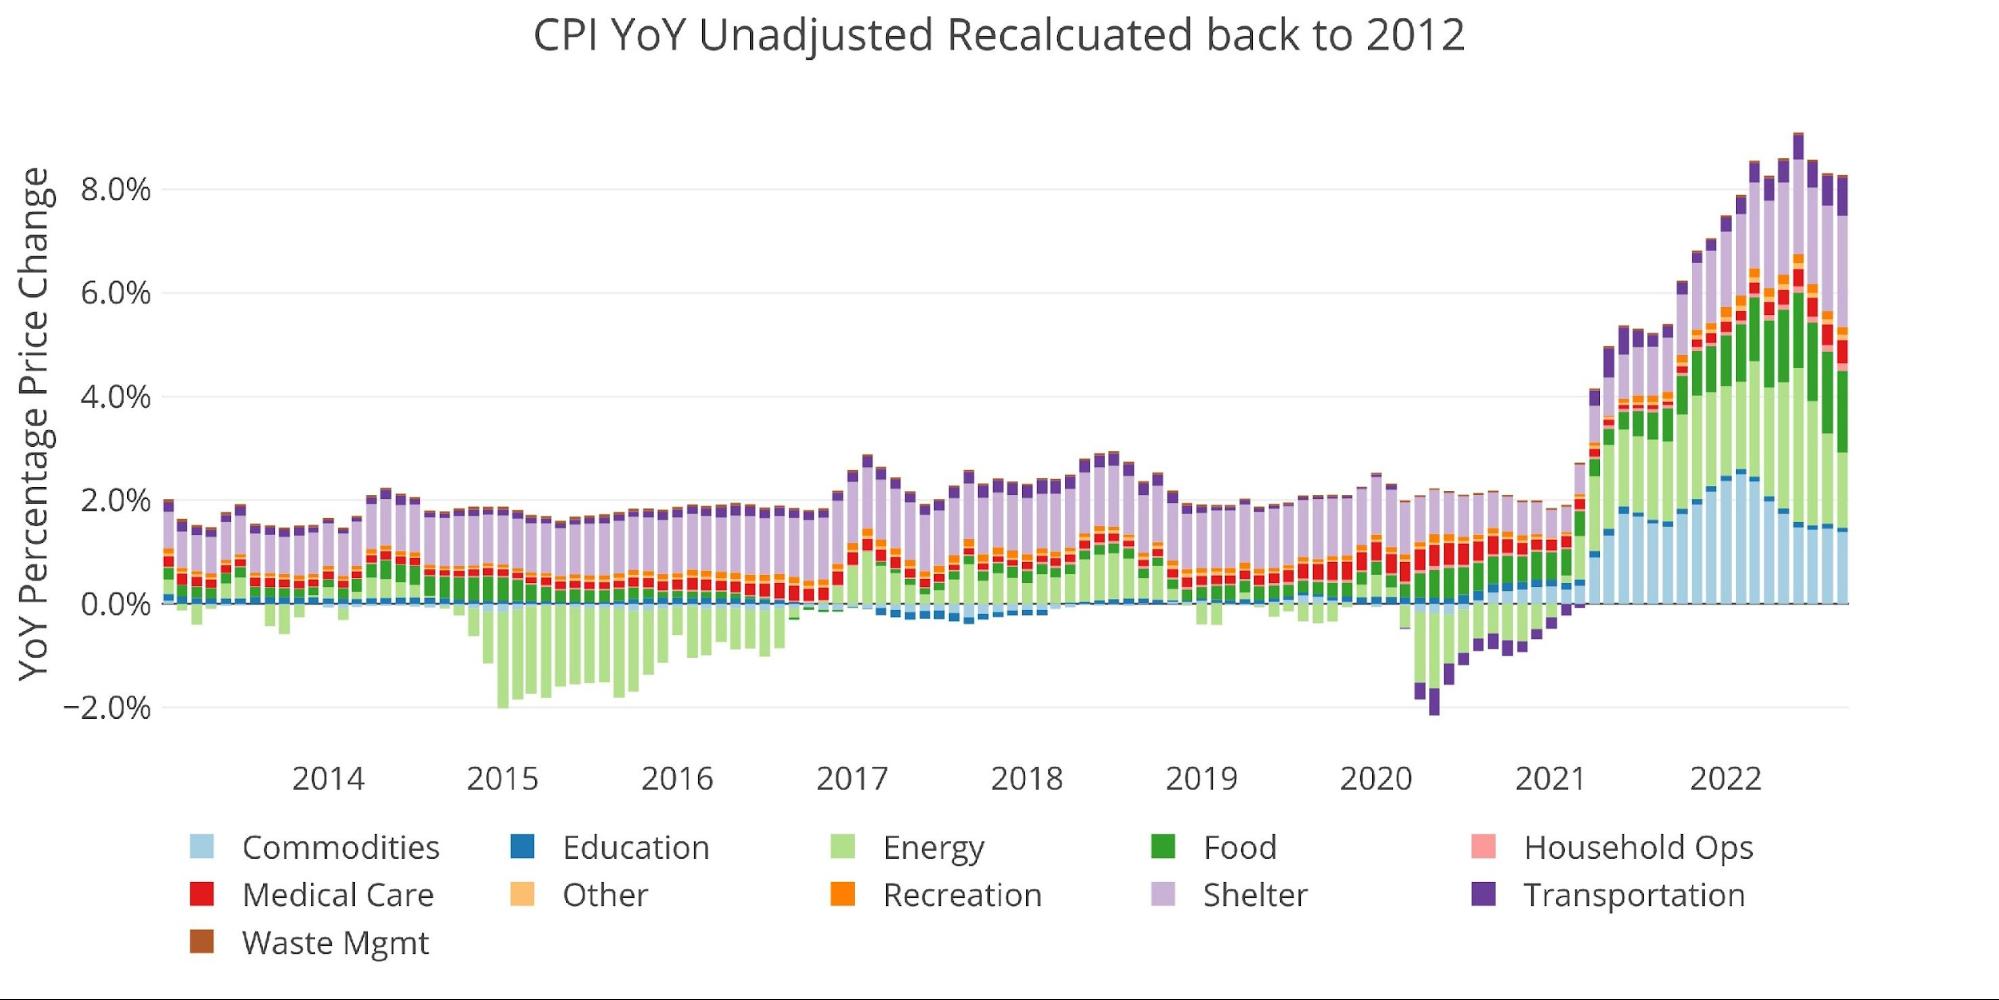
The BLS weightings have only been scraped back to 2012, thus the chart below shows the past 10 years of annual inflation data, reported monthly. The volatility in Energy can be seen clearly over this time period.
The YoY CPI first went over 4% in April of 2021. The recent drop has stabilized with the latest month. Increased Energy prices in October could very well keep the CPI from going down.
Figure: 8 Historical CPI
What it means for Gold and Silver
Last October, the CPI was up 0.87% MoM. Given this large value falling off next month, there may be another reduction in the YoY number with the next CPU release. But the Fed is very focused on the monthly number to ensure the trend is down. Unfortunately, the stickier prices will likely keep the CPI high again next month even if it is less than 0.87%.
This keeps the pressure on the Fed to keep raising rates. The Fed has been playing Chicken with the market, promising to get inflation under control before lowering rates again. Higher inflation forces them to keep raising, but they only have so much runway before something breaks.
This won’t be a little break (e.g., Q4 2018), a big break (e.g., U.K. Pensions), or even a very large break (e.g., Great Financial Crisis). When the Fed breaks something this time, it will be THE break. Something that will send tidal waves through the global economy. At this point, everyone will see the Fed has been bluffing all along and the game of Chicken will come to a sudden halt.
In order to avoid breaking something (though it’s probably too late) and sending the Federal government into a debt spiral, the CPI needs to be crashing so the Fed can call off the rate hikes. But the CPI cannot come down significantly while real rates are still negative. The mainstream can claim the latest CPI as good news because the three-month trend is down. But this completely ignores the impact of Energy and the usage of the SPR to create the recent and temporary relief. It’s a mirage!
Once Energy starts climbing in the face of the Fed hikes, people will wake up to the new paradigm that higher inflation is here to stay. At the same time, the Fed will likely be at or near a pivot to support a crashing economy. These two events together will launch silver and gold to new all-time highs.
Data Source: https://www.bls.gov/cpi/ and https://fred.stlouisfed.org/series/CPIAUCSL
More By This Author:
Bill Introduced In Congress To Put The US Back On A Gold Standard
The Fed Didn’t Create The Inflation Problem Last Year It Was Decades In The Making
Treasury Locks in Higher Rates for Longer Despite Exploding Interest Costs

