
COT Soft Commodities Speculators Push Soybean Bullish Bets To 33-Week High
Here are the latest charts and statistics for the Commitment of Traders (COT) data published by the Commodities Futures Trading Commission (CFTC). The latest COT data is updated through Tuesday, Feb. 1 and shows a quick view of how large traders (for-profit speculators and commercial entities) were positioned in the futures markets.
Highlighting the COT soft commodities data is the gains in Soybeans futures bets. The speculative net position in the Soybeans futures jumped this week by +44,501 contracts, the largest one-week gain in the past seventy-four weeks, dating back to September of 2020. Speculators have been boosting their Soybeans positions higher as bullish bets have risen for two straight weeks and in ten out of the past twelve weeks.
The speculator standing has ascended to the highest total of the past thirty-three weeks, and is on the cusp of an extreme bullish reading (78.1%) for speculators (current level compared to past three years of data where above 80% is extreme bullish and below 20% is extreme bearish).
The soft commodities that saw higher bets this week were Corn (16,122 contracts), Soybeans (44,501 contracts), Soybean Oil (5,938 contracts), Soybean Meal (19,821 contracts), Live Cattle (16,867 contracts), Lean Hogs (1,475 contracts) and Cotton (5,213 contracts).
The markets with lower speculator bets were Sugar (-27,690 contracts), Coffee (-265 contracts), Cocoa (-858 contracts), and Wheat (-11,311 contracts).
Data Snapshot of Commodity Market Traders | Columns Legend
|
WTI Crude |
2,093,735 |
35 |
368,904 |
27 |
-414,658 |
63 |
45,754 |
79 |
|
Corn |
1,568,959 |
33 |
455,220 |
88 |
-407,663 |
14 |
-47,557 |
16 |
|
Natural Gas |
1,162,813 |
12 |
-120,010 |
43 |
90,241 |
59 |
29,769 |
54 |
|
Sugar |
897,035 |
17 |
93,593 |
56 |
-117,500 |
46 |
23,907 |
37 |
|
Soybeans |
796,285 |
44 |
193,373 |
78 |
-155,577 |
29 |
-37,796 |
9 |
|
Gold |
515,331 |
23 |
172,142 |
43 |
-201,342 |
56 |
29,200 |
47 |
|
Wheat |
391,162 |
29 |
350 |
47 |
5,100 |
46 |
-5,450 |
76 |
|
Heating Oil |
347,383 |
30 |
15,683 |
65 |
-43,137 |
25 |
27,454 |
93 |
|
Coffee |
274,865 |
40 |
61,378 |
93 |
-65,365 |
9 |
3,987 |
16 |
|
Brent |
203,928 |
42 |
-18,920 |
86 |
15,734 |
15 |
3,186 |
52 |
|
Copper |
198,437 |
25 |
16,155 |
54 |
-21,053 |
45 |
4,898 |
54 |
|
Silver |
149,136 |
15 |
22,118 |
44 |
-35,263 |
64 |
13,145 |
19 |
|
Platinum |
53,898 |
11 |
14,581 |
23 |
-19,786 |
81 |
5,205 |
35 |
|
Palladium |
7,853 |
6 |
-992 |
15 |
965 |
83 |
27 |
46 |
Corn Futures
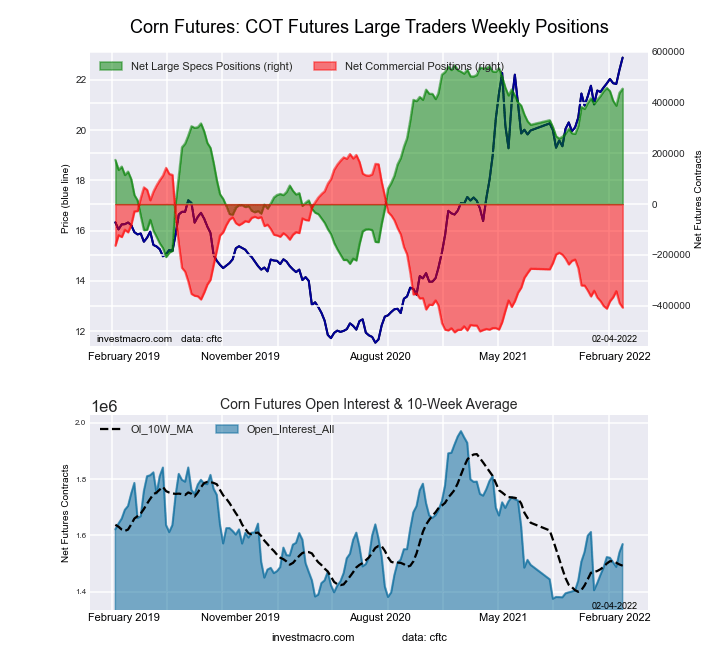
The Corn large speculator standing this week came in at a net position of 455,220 contracts in the data reported through Tuesday. This was a weekly rise of 16,122 contracts from the previous week, which had a total of 439,098 net contracts.
This week’s current strength score (the trader positioning range over the past three years, measured from 0 to 100) shows the speculators are currently Bullish-Extreme with a score of 88.2%. The commercials are Bearish-Extreme with a score of 13.9% and the small traders (not shown in chart) are Bearish-Extreme with a score of 15.7%.
|
CORN Futures Statistics |
SPECULATORS |
COMMERCIALS |
SMALL TRADERS |
|
– % of Open Interest Longs: |
34.9 |
43.3 |
9.0 |
|
– % of Open Interest Shorts: |
5.9 |
69.3 |
12.0 |
|
– Net Position: |
455,220 |
-407,663 |
-47,557 |
|
– Gross Longs: |
547,596 |
679,215 |
140,463 |
|
– Gross Shorts: |
92,376 |
1,086,878 |
188,020 |
|
– Long to Short Ratio: |
5.9 to 1 |
0.6 to 1 |
0.7 to 1 |
|
NET POSITION TREND: |
|
|
|
|
– Strength Index Score (3 Year Range Pct): |
88.2 |
13.9 |
15.7 |
|
– Strength Index Reading (3 Year Range): |
Bullish-Extreme |
Bearish-Extreme |
Bearish-Extreme |
|
NET POSITION MOVEMENT INDEX: |
|
|
|
|
– 6-Week Change in Strength Index: |
1.3 |
-0.9 |
-2.0 |
Sugar Futures
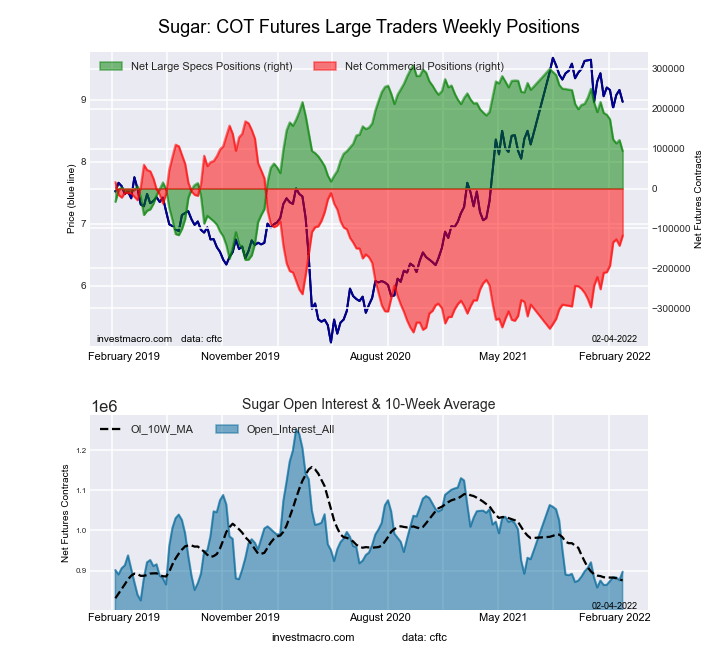
The Sugar large speculator standing this week came in at a net position of 93,593 contracts in the data reported through Tuesday. This was a weekly fall of -27,690 contracts from the previous week, which had a total of 121,283 net contracts.
This week’s current strength score (the trader positioning range over the past three years, measured from 0 to 100) shows the speculators are currently Bullish with a score of 55.9%. The commercials are Bearish with a score of 45.9% and the small traders (not shown in chart) are Bearish with a score of 37.4%.
|
SUGAR Futures Statistics |
SPECULATORS |
COMMERCIALS |
SMALL TRADERS |
|
– % of Open Interest Longs: |
20.2 |
55.9 |
8.9 |
|
– % of Open Interest Shorts: |
9.8 |
69.0 |
6.2 |
|
– Net Position: |
93,593 |
-117,500 |
23,907 |
|
– Gross Longs: |
181,186 |
501,416 |
79,413 |
|
– Gross Shorts: |
87,593 |
618,916 |
55,506 |
|
– Long to Short Ratio: |
2.1 to 1 |
0.8 to 1 |
1.4 to 1 |
|
NET POSITION TREND: |
|
|
|
|
– Strength Index Score (3 Year Range Pct): |
55.9 |
45.9 |
37.4 |
|
– Strength Index Reading (3 Year Range): |
Bullish |
Bearish |
Bearish |
|
NET POSITION MOVEMENT INDEX: |
|
|
|
|
– 6-Week Change in Strength Index: |
-19.6 |
17.7 |
2.9 |
Coffee Futures
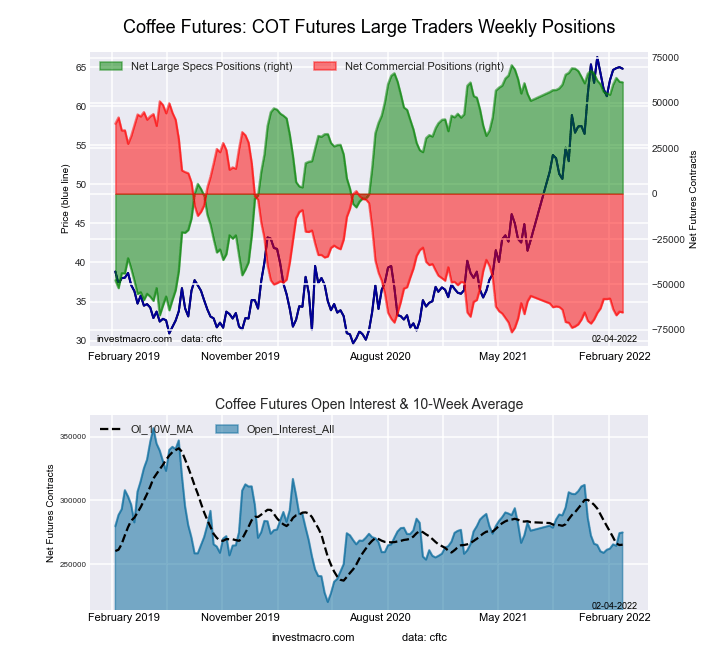
The Coffee large speculator standing this week came in at a net position of 61,378 contracts in the data reported through Tuesday. This was a weekly decline of -265 contracts from the previous week, which had a total of 61,643 net contracts.
This week’s current strength score (the trader positioning range over the past three years, measured from 0 to 100) shows the speculators are currently Bullish-Extreme with a score of 93.2%. The commercials are Bearish-Extreme with a score of 8.6% and the small traders (not shown in chart) are Bearish-Extreme with a score of 15.9%.
|
COFFEE Futures Statistics |
SPECULATORS |
COMMERCIALS |
SMALL TRADERS |
|
– % of Open Interest Longs: |
27.3 |
42.7 |
4.1 |
|
– % of Open Interest Shorts: |
5.0 |
66.5 |
2.6 |
|
– Net Position: |
61,378 |
-65,365 |
3,987 |
|
– Gross Longs: |
75,016 |
117,397 |
11,261 |
|
– Gross Shorts: |
13,638 |
182,762 |
7,274 |
|
– Long to Short Ratio: |
5.5 to 1 |
0.6 to 1 |
1.5 to 1 |
|
NET POSITION TREND: |
|
|
|
|
– Strength Index Score (3 Year Range Pct): |
93.2 |
8.6 |
15.9 |
|
– Strength Index Reading (3 Year Range): |
Bullish-Extreme |
Bearish-Extreme |
Bearish-Extreme |
|
NET POSITION MOVEMENT INDEX: |
|
|
|
|
– 6-Week Change in Strength Index: |
3.8 |
-5.8 |
14.8 |
Soybeans Futures
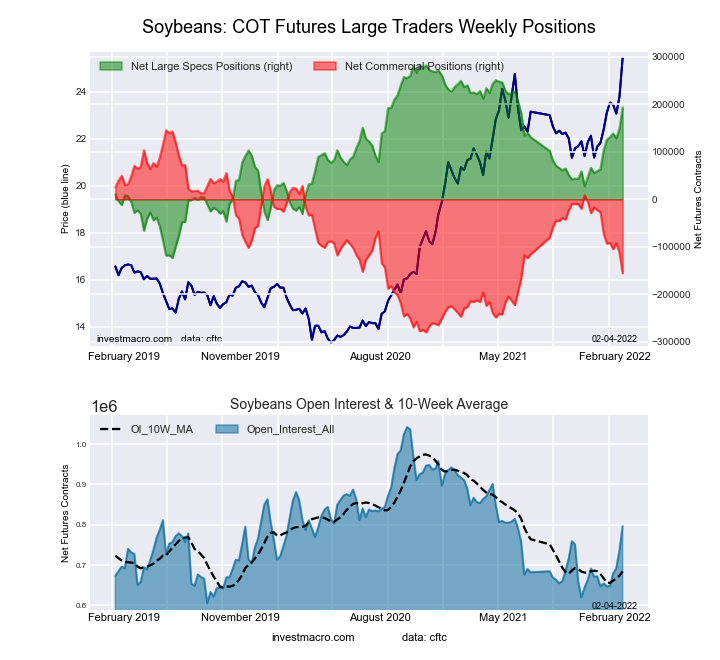
The Soybeans large speculator standing this week came in at a net position of 193,373 contracts in the data reported through Tuesday. This was a weekly rise of 44,501 contracts from the previous week, which had a total of 148,872 net contracts.
This week’s current strength score (the trader positioning range over the past three years, measured from 0 to 100) shows the speculators are currently Bullish with a score of 78.1%. The commercials are Bearish with a score of 29.2% and the small traders (not shown in chart) are Bearish-Extreme with a score of 9.0%.
|
SOYBEANS Futures Statistics |
SPECULATORS |
COMMERCIALS |
SMALL TRADERS |
|
– % of Open Interest Longs: |
29.6 |
47.0 |
6.4 |
|
– % of Open Interest Shorts: |
5.3 |
66.5 |
11.1 |
|
– Net Position: |
193,373 |
-155,577 |
-37,796 |
|
– Gross Longs: |
235,972 |
374,270 |
50,921 |
|
– Gross Shorts: |
42,599 |
529,847 |
88,717 |
|
– Long to Short Ratio: |
5.5 to 1 |
0.7 to 1 |
0.6 to 1 |
|
NET POSITION TREND: |
|
|
|
|
– Strength Index Score (3 Year Range Pct): |
78.1 |
29.2 |
9.0 |
|
– Strength Index Reading (3 Year Range): |
Bullish |
Bearish |
Bearish-Extreme |
|
NET POSITION MOVEMENT INDEX: |
|
|
|
|
– 6-Week Change in Strength Index: |
22.3 |
-19.6 |
-12.1 |
Soybean Oil Futures
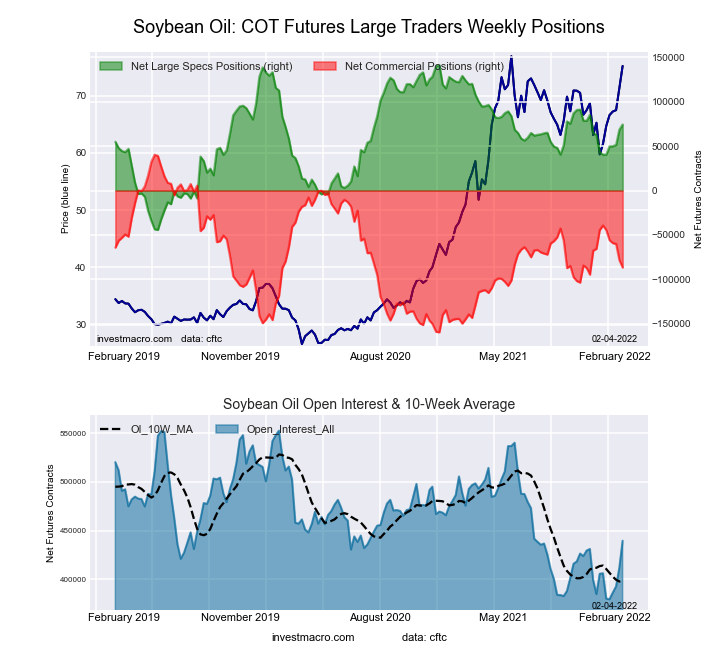
The Soybean Oil large speculator standing this week came in at a net position of 74,410 contracts in the data reported through Tuesday. This was a weekly gain of 5,938 contracts from the previous week, which had a total of 68,472 net contracts.
This week’s current strength score (the trader positioning range over the past three years, measured from 0 to 100) shows the speculators are currently Bullish with a score of 64.0%. The commercials are Bearish with a score of 36.5% and the small traders (not shown in chart) are Bullish with a score of 58.9%.
|
SOYBEAN OIL Futures Statistics |
SPECULATORS |
COMMERCIALS |
SMALL TRADERS |
|
– % of Open Interest Longs: |
25.6 |
45.6 |
8.5 |
|
– % of Open Interest Shorts: |
8.7 |
65.3 |
5.8 |
|
– Net Position: |
74,410 |
-86,588 |
12,178 |
|
– Gross Longs: |
112,593 |
200,533 |
37,458 |
|
– Gross Shorts: |
38,183 |
287,121 |
25,280 |
|
– Long to Short Ratio: |
2.9 to 1 |
0.7 to 1 |
1.5 to 1 |
|
NET POSITION TREND: |
|
|
|
|
– Strength Index Score (3 Year Range Pct): |
64.0 |
36.5 |
58.9 |
|
– Strength Index Reading (3 Year Range): |
Bullish |
Bearish |
Bullish |
|
NET POSITION MOVEMENT INDEX: |
|
|
|
|
– 6-Week Change in Strength Index: |
18.3 |
-23.7 |
49.6 |
Soybean Meal Futures
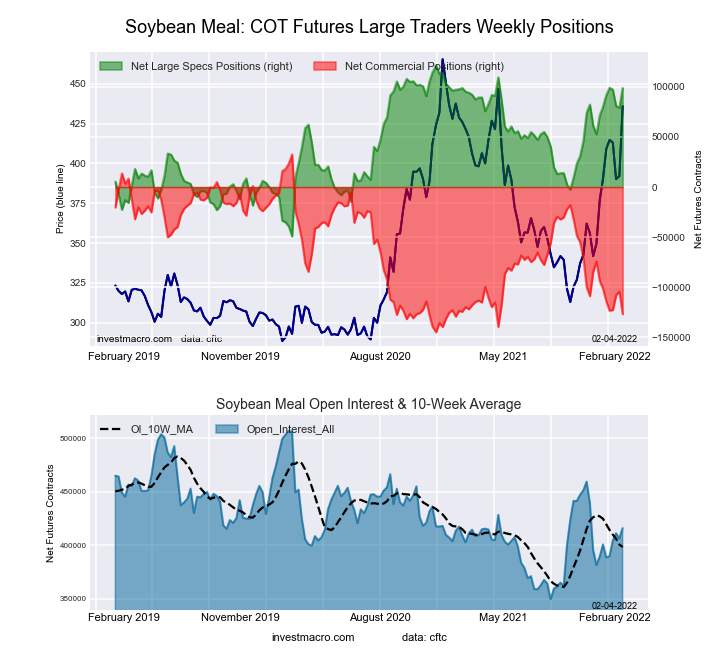
The Soybean Meal large speculator standing this week came in at a net position of 98,839 contracts in the data reported through Tuesday. This was a weekly advance of 19,821 contracts from the previous week, which had a total of 79,018 net contracts.
This week’s current strength score (the trader positioning range over the past three years, measured from 0 to 100) shows the speculators are currently Bullish-Extreme with a score of 86.7%. The commercials are Bearish-Extreme with a score of 10.2% and the small traders (not shown in chart) are Bullish-Extreme with a score of 83.3%.
|
SOYBEAN MEAL Futures Statistics |
SPECULATORS |
COMMERCIALS |
SMALL TRADERS |
|
– % of Open Interest Longs: |
28.1 |
44.3 |
11.9 |
|
– % of Open Interest Shorts: |
4.3 |
74.8 |
5.1 |
|
– Net Position: |
98,839 |
-126,965 |
28,126 |
|
– Gross Longs: |
116,823 |
184,206 |
49,421 |
|
– Gross Shorts: |
17,984 |
311,171 |
21,295 |
|
– Long to Short Ratio: |
6.5 to 1 |
0.6 to 1 |
2.3 to 1 |
|
NET POSITION TREND: |
|
|
|
|
– Strength Index Score (3 Year Range Pct): |
86.7 |
10.2 |
83.3 |
|
– Strength Index Reading (3 Year Range): |
Bullish-Extreme |
Bearish-Extreme |
Bullish-Extreme |
|
NET POSITION MOVEMENT INDEX: |
|
|
|
|
– 6-Week Change in Strength Index: |
10.9 |
-14.4 |
27.2 |
Live Cattle Futures
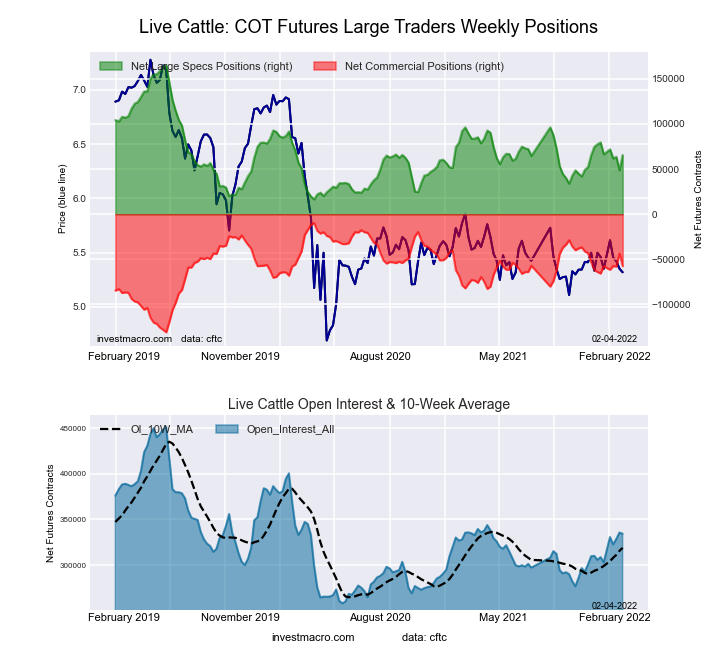
The Live Cattle large speculator standing this week came in at a net position of 65,508 contracts in the data reported through Tuesday. This was a weekly increase of 16,867 contracts from the previous week, which had a total of 48,641 net contracts.
This week’s current strength score (the trader positioning range over the past three years, measured from 0 to 100) shows the speculators are currently Bearish with a score of 33.0%. The commercials are Bullish with a score of 60.5% and the small traders (not shown in chart) are Bullish with a score of 67.7%.
|
LIVE CATTLE Futures Statistics |
SPECULATORS |
COMMERCIALS |
SMALL TRADERS |
|
– % of Open Interest Longs: |
35.5 |
38.1 |
10.7 |
|
– % of Open Interest Shorts: |
15.9 |
55.3 |
13.1 |
|
– Net Position: |
65,508 |
-57,535 |
-7,973 |
|
– Gross Longs: |
118,790 |
127,335 |
35,671 |
|
– Gross Shorts: |
53,282 |
184,870 |
43,644 |
|
– Long to Short Ratio: |
2.2 to 1 |
0.7 to 1 |
0.8 to 1 |
|
NET POSITION TREND: |
|
|
|
|
– Strength Index Score (3 Year Range Pct): |
33.0 |
60.5 |
67.7 |
|
– Strength Index Reading (3 Year Range): |
Bearish |
Bullish |
Bullish |
|
NET POSITION MOVEMENT INDEX: |
|
|
|
|
– 6-Week Change in Strength Index: |
-0.6 |
0.1 |
1.6 |
Lean Hogs Futures
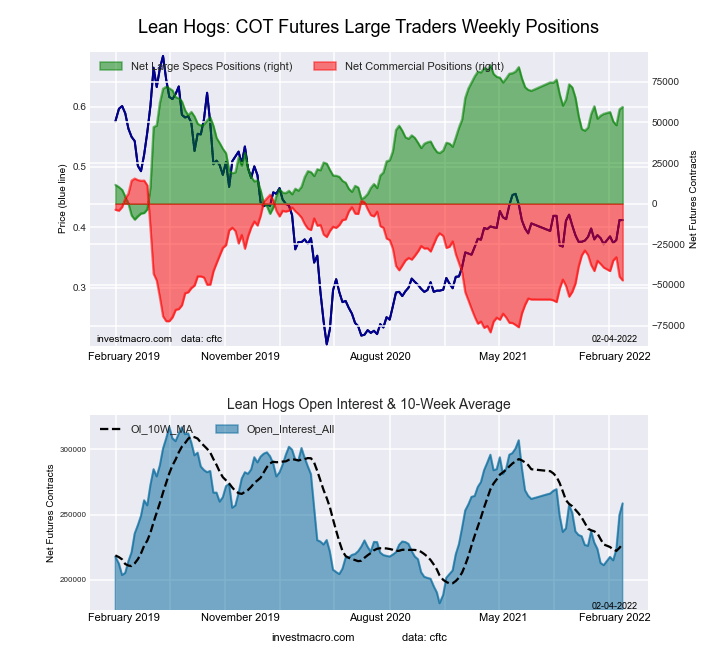
The Lean Hogs large speculator standing this week came in at a net position of 59,521 contracts in the data reported through Tuesday. This was a weekly boost of 1,475 contracts from the previous week, which had a total of 58,046 net contracts.
This week’s current strength score (the trader positioning range over the past three years, measured from 0 to 100) shows the speculators are currently Bullish with a score of 72.7%. The commercials are Bearish with a score of 33.8% and the small traders (not shown in chart) are Bearish with a score of 26.6%.
|
LEAN HOGS Futures Statistics |
SPECULATORS |
COMMERCIALS |
SMALL TRADERS |
|
– % of Open Interest Longs: |
39.7 |
33.5 |
8.5 |
|
– % of Open Interest Shorts: |
16.6 |
51.7 |
13.2 |
|
– Net Position: |
59,521 |
-47,148 |
-12,373 |
|
– Gross Longs: |
102,573 |
86,681 |
21,898 |
|
– Gross Shorts: |
43,052 |
133,829 |
34,271 |
|
– Long to Short Ratio: |
2.4 to 1 |
0.6 to 1 |
0.6 to 1 |
|
NET POSITION TREND: |
|
|
|
|
– Strength Index Score (3 Year Range Pct): |
72.7 |
33.8 |
26.6 |
|
– Strength Index Reading (3 Year Range): |
Bullish |
Bearish |
Bearish |
|
NET POSITION MOVEMENT INDEX: |
|
|
|
|
– 6-Week Change in Strength Index: |
4.4 |
-8.3 |
15.6 |
Cotton Futures
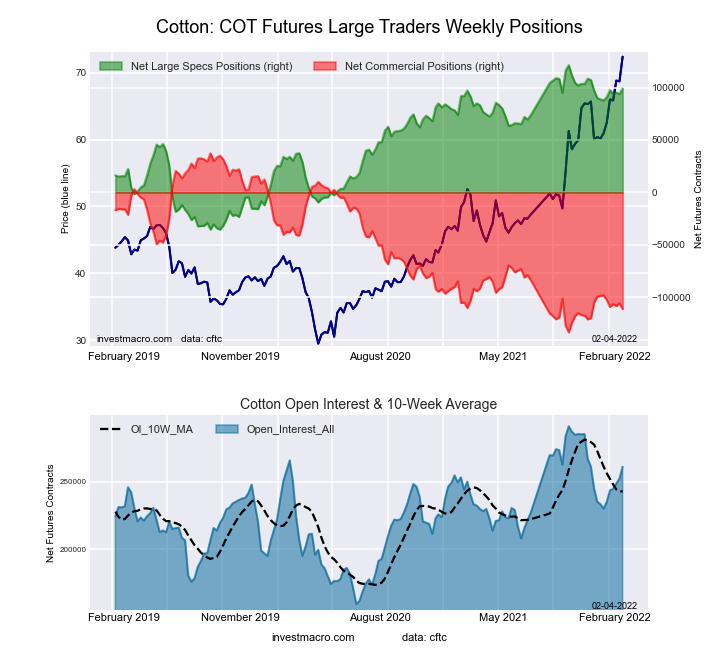
The Cotton large speculator standing this week came in at a net position of 99,000 contracts in the data reported through Tuesday. This was a weekly gain of 5,213 contracts from the previous week, which had a total of 93,787 net contracts.
This week’s current strength score (the trader positioning range over the past three years, measured from 0 to 100) shows the speculators are currently Bullish-Extreme with a score of 85.8%. The commercials are Bearish-Extreme with a score of 13.0% and the small traders (not shown in chart) are Bullish-Extreme with a score of 89.1%.
|
COTTON Futures Statistics |
SPECULATORS |
COMMERCIALS |
SMALL TRADERS |
|
– % of Open Interest Longs: |
43.6 |
33.5 |
7.8 |
|
– % of Open Interest Shorts: |
5.7 |
76.1 |
3.2 |
|
– Net Position: |
99,000 |
-111,100 |
12,100 |
|
– Gross Longs: |
113,867 |
87,358 |
20,428 |
|
– Gross Shorts: |
14,867 |
198,458 |
8,328 |
|
– Long to Short Ratio: |
7.7 to 1 |
0.4 to 1 |
2.5 to 1 |
|
NET POSITION TREND: |
|
|
|
|
– Strength Index Score (3 Year Range Pct): |
85.8 |
13.0 |
89.1 |
|
– Strength Index Reading (3 Year Range): |
Bullish-Extreme |
Bearish-Extreme |
Bullish-Extreme |
|
NET POSITION MOVEMENT INDEX: |
|
|
|
|
– 6-Week Change in Strength Index: |
7.2 |
-7.6 |
10.8 |
Cocoa Futures
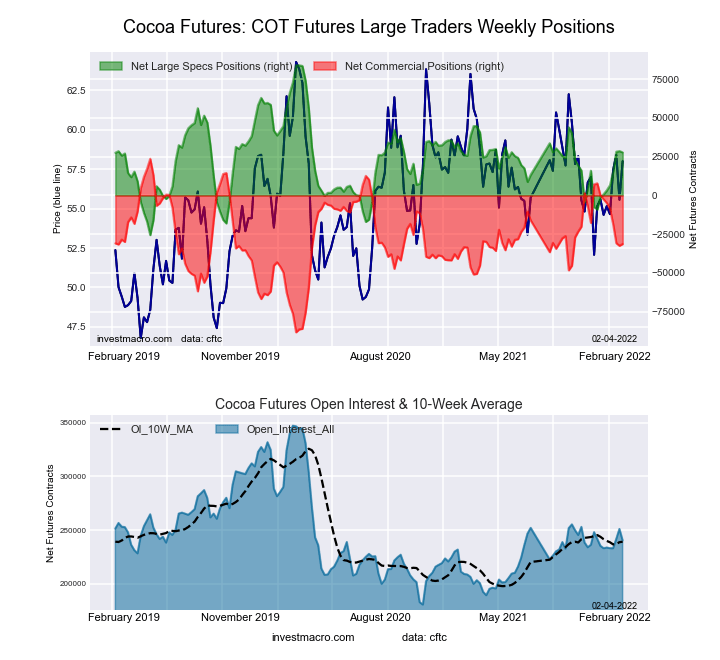
The Cocoa large speculator standing this week came in at a net position of 27,762 contracts in the data reported through Tuesday. This was a weekly lowering of -858 contracts from the previous week, which had a total of 28,620 net contracts.
This week’s current strength score (the trader positioning range over the past three years, measured from 0 to 100) shows the speculators are currently Bearish with a score of 48.6%. The commercials are Bullish with a score of 50.9% and the small traders (not shown in chart) are Bearish with a score of 49.3%.
|
COCOA Futures Statistics |
SPECULATORS |
COMMERCIALS |
SMALL TRADERS |
|
– % of Open Interest Longs: |
27.1 |
46.8 |
5.2 |
|
– % of Open Interest Shorts: |
15.6 |
59.8 |
3.7 |
|
– Net Position: |
27,762 |
-31,350 |
3,588 |
|
– Gross Longs: |
65,259 |
112,462 |
12,556 |
|
– Gross Shorts: |
37,497 |
143,812 |
8,968 |
|
– Long to Short Ratio: |
1.7 to 1 |
0.8 to 1 |
1.4 to 1 |
|
NET POSITION TREND: |
|
|
|
|
– Strength Index Score (3 Year Range Pct): |
48.6 |
50.9 |
49.3 |
|
– Strength Index Reading (3 Year Range): |
Bearish |
Bullish |
Bearish |
|
NET POSITION MOVEMENT INDEX: |
|
|
|
|
– 6-Week Change in Strength Index: |
24.7 |
-25.7 |
20.0 |
Wheat Futures
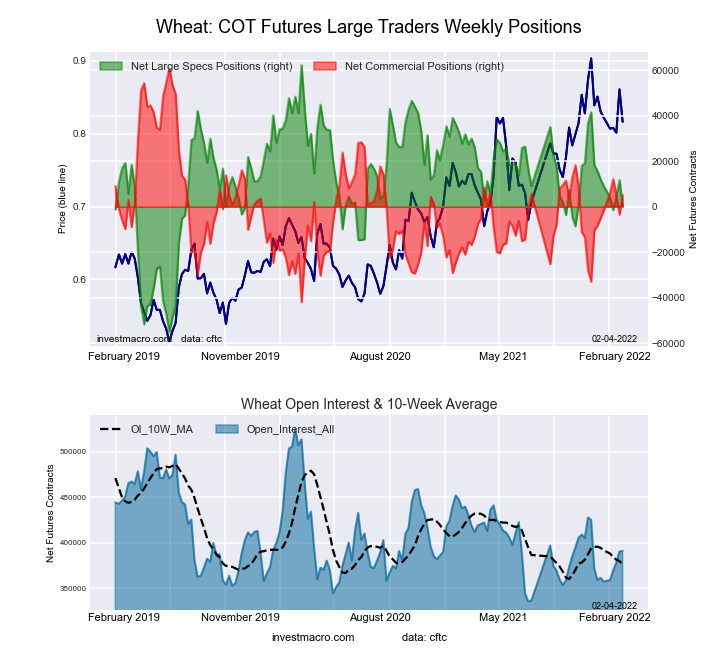
The Wheat large speculator standing this week came in at a net position of 350 contracts in the data reported through Tuesday. This was a weekly decline of -11,311 contracts from the previous week, which had a total of 11,661 net contracts.
This week’s current strength score (the trader positioning range over the past three years, measured from 0 to 100) shows the speculators are currently Bearish with a score of 47.3%. The commercials are Bearish with a score of 45.8% and the small traders (not shown in chart) are Bullish with a score of 75.5%.
|
WHEAT Futures Statistics |
SPECULATORS |
COMMERCIALS |
SMALL TRADERS |
|
– % of Open Interest Longs: |
27.0 |
38.3 |
8.6 |
|
– % of Open Interest Shorts: |
26.9 |
37.0 |
10.0 |
|
– Net Position: |
350 |
5,100 |
-5,450 |
|
– Gross Longs: |
105,427 |
149,988 |
33,576 |
|
– Gross Shorts: |
105,077 |
144,888 |
39,026 |
|
– Long to Short Ratio: |
1.0 to 1 |
1.0 to 1 |
0.9 to 1 |
|
NET POSITION TREND: |
|
|
|
|
– Strength Index Score (3 Year Range Pct): |
47.3 |
45.8 |
75.5 |
|
– Strength Index Reading (3 Year Range): |
Bearish |
Bearish |
Bullish |
|
NET POSITION MOVEMENT INDEX: |
|
|
|
|
– 6-Week Change in Strength Index: |
-7.5 |
6.5 |
9.9 |
Article By InvestMacro – Receive our weekly COT Reports by Email
* more


