
Corn Prices – Has The Correction Run Its Course?
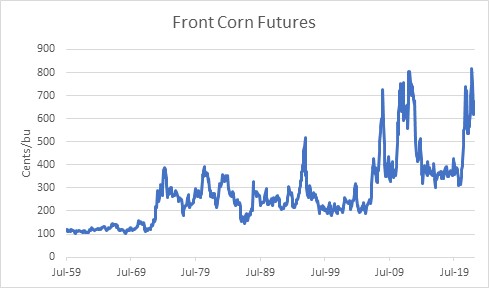
Recently there has understandably been a lot of focus on the extremely high prices of agricultural products. The front Corn futures contract hit an all-time month-end high back in April, at over $8/bu (see chart, source Bloomberg). Over the last decade-plus, in fact, grain prices have been generally higher and more volatile than in the 40 or so years prior to the GFC.
It is always good to remember, though, that because the overall value of the currency is in more or less perpetual decline, it is expected that the price of any good or service should be expected to rise over time. The more important question is, what has the real price of grains done over the decades? And here, the picture is starkly different and looks like the chart of many, many goods. It’s the way that the real price of consumer goods should look over time, given that the arrow of productivity points mostly in one direction. This chart shows the price of corn, in 2022 dollars. Back in the 1970s, corn only cost $3/bu, but the dollar was worth more then. It would have taken more than $20 of today’s dollars to buy a bushel of corn in mid-1974.
The chart also has an orange line on it, which shows the US Cereal Crop Yield each year according to the World Bank.[1] I’ve inverted that series so that when we are able to get more crops from each hectare, the line declines. It’s also on a logarithmic axis.
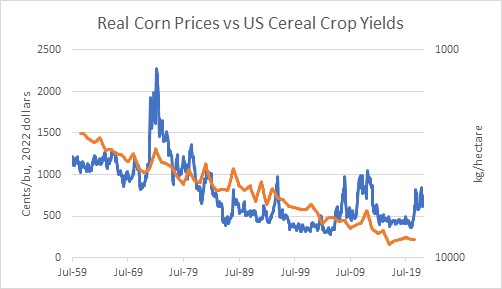
The point of this chart is merely to illustrate that real corn prices have declined over a long period of time because contrary to Mathus’s fears the production of cereal grains has been able to keep up and in fact exceed the increase in the demand for them over time. The chart is necessarily imprecise since we’re not considering how the number of hectares producing corn changes each year, and we’re not looking at specific corn yields. Nevertheless, you will notice that many of the spikes in prices are associated with spikes (that is, dips since it’s inverted) in crop yields. Which makes sense, of course.
What causes changes in crop yields? Different planting and harvesting techniques are obvious improvements that are pretty much one-way. Also, improved fertilizers and pest control, and better use of the proper mix of fertilizers. But then why do crop yields sometimes decrease, if all of these things tend to get better over time?
One obvious answer to that is the weather. Less obvious is that the use of fertilizers isn’t constant. When fertilizer prices are high, farmers try to use less, and that reduces crop yields. Also – and this is directly relevant to today – when there is a shortage of fertilizer then less of it is used and the price of fertilizer goes up. With the conflict in Ukraine and the cutting off of natural gas supplies to Europe (natty is an important input into the manufacture of some fertilizers), we are in that sort of situation. If we overlay real corn prices with real fertilizer prices[2] you can tell that these are closely related series.
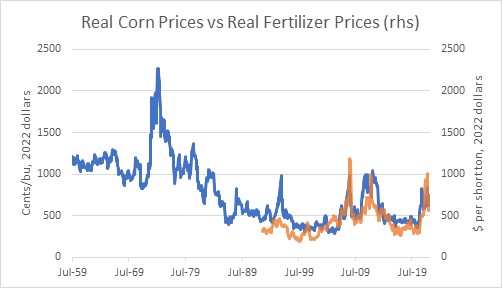
So in the long run, the general level of corn prices is driven by the purchasing power of the dollar (aka the overall price level) and the steady improvement in agricultural productivity. In the short run, corn prices are driven by fertilizer prices.
Fertilizer prices have come down somewhat. The continued embargo of natural gas into Europe has only a small effect on fertilizer supply, and Russia only directly provides about 10% of the global supply of fertilizers.[3] But the overall level of commodity inputs into the manufacture of various sorts of fertilizer obviously impacts the output price. I suspect it will be a while before fertilizer prices even in real terms get back to their pre-COVID levels. And the overall CPI is not about to decline any time soon. Does that mean that corn (and wheat, etc etc) prices can’t decline from here? Of course not – but my guess is that we’ve seen most of the good news on the agricultural commodity front for a while.
[1] https://data.worldbank.org/indicator/AG.YLD.CREL.KG?locations=US Annual data through 2020.
[2] US Cornbelt Urea Granular Spot Price, source Bloomberg. The 1:1 congruence of scales and amplitudes is mostly coincidental – one is cents per bushel and one is dollars per short ton.
[3] https://www.fas.usda.gov/data/impacts-and-repercussions-price-increases-global-fertilizer-market
More By This Author:
Do Rents Really Actually Lead Home Prices?The Coming Rise In Money Velocity
One Experiment Ends and Another Begins


